Fig. 2.
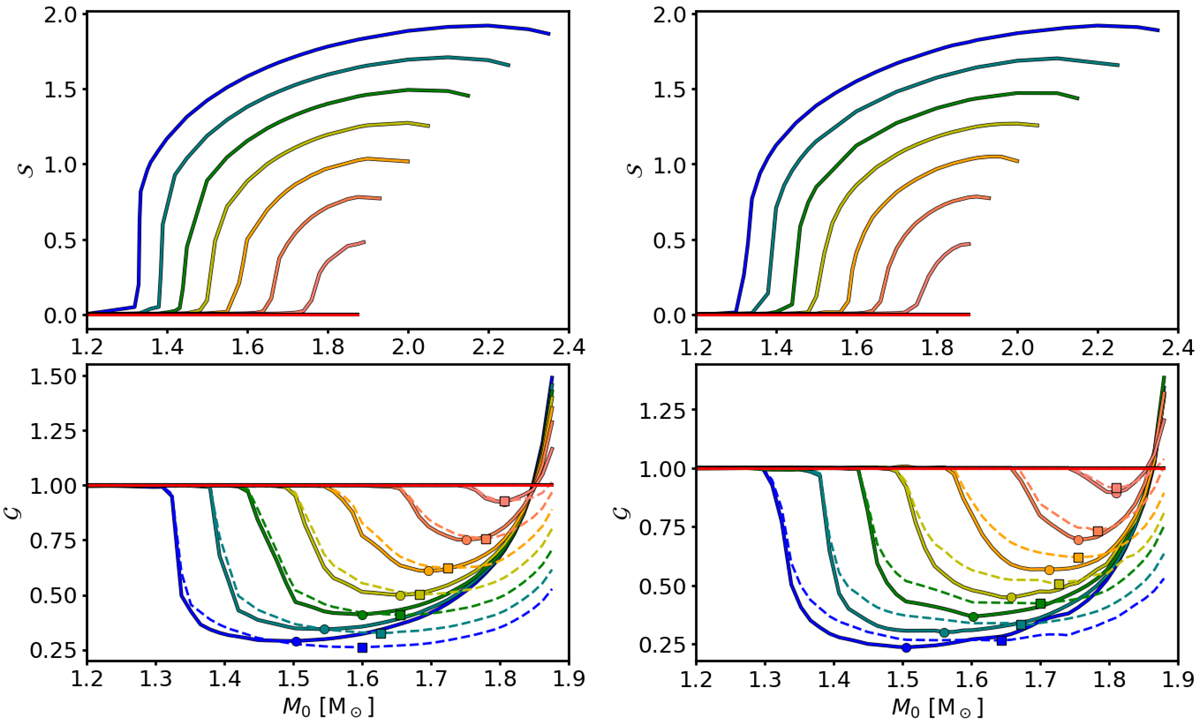
Ratios 𝒮 (top panels) and 𝒢 (bottom panels) as functions of the baryonic mass M0 of models with a purely toroidal magnetic field (left panels) and with a purely poloidal magnetic field (right panels), for different value of β0: from β0 = −6 (blue curve) up to β0 = −4.5 (light red curve) increasing by 0.25 with every line. The red line corresponds to GR, where 𝒮 = 0 and 𝒢 = 1. Solid lines are the ratios computed by keeping B̃max fixed, while dashed lines are obtained by keeping ![]() fixed. Markers show the models with minimum 𝒢: circles for solid lines and squares for dashed lines.
fixed. Markers show the models with minimum 𝒢: circles for solid lines and squares for dashed lines.
Current usage metrics show cumulative count of Article Views (full-text article views including HTML views, PDF and ePub downloads, according to the available data) and Abstracts Views on Vision4Press platform.
Data correspond to usage on the plateform after 2015. The current usage metrics is available 48-96 hours after online publication and is updated daily on week days.
Initial download of the metrics may take a while.