Fig. 9
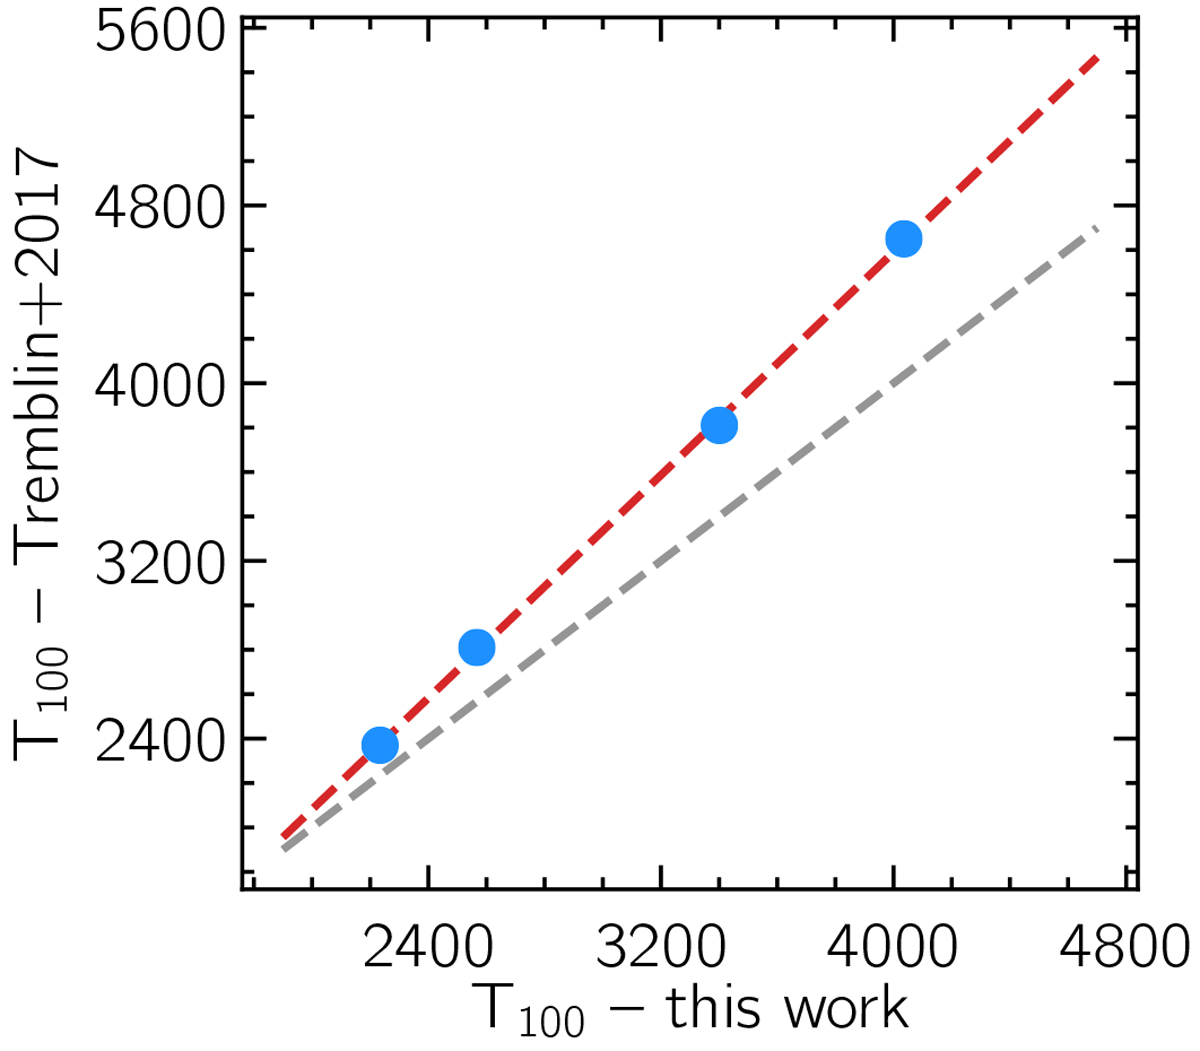
Temperature at 100 bar derived from our PT structures compared to the values from the average PT profiles using 2D circulation models presented by Tremblin et al. (2017) resulting from the advection of potential temperature. All the models correspond to a planet with log g = 2.97 ± 0.15 and increasing stellar incident flux. The gray dashed line shows the 1:1 relation while the red dashed line shows the fit to the data.
Current usage metrics show cumulative count of Article Views (full-text article views including HTML views, PDF and ePub downloads, according to the available data) and Abstracts Views on Vision4Press platform.
Data correspond to usage on the plateform after 2015. The current usage metrics is available 48-96 hours after online publication and is updated daily on week days.
Initial download of the metrics may take a while.