Fig. 9.
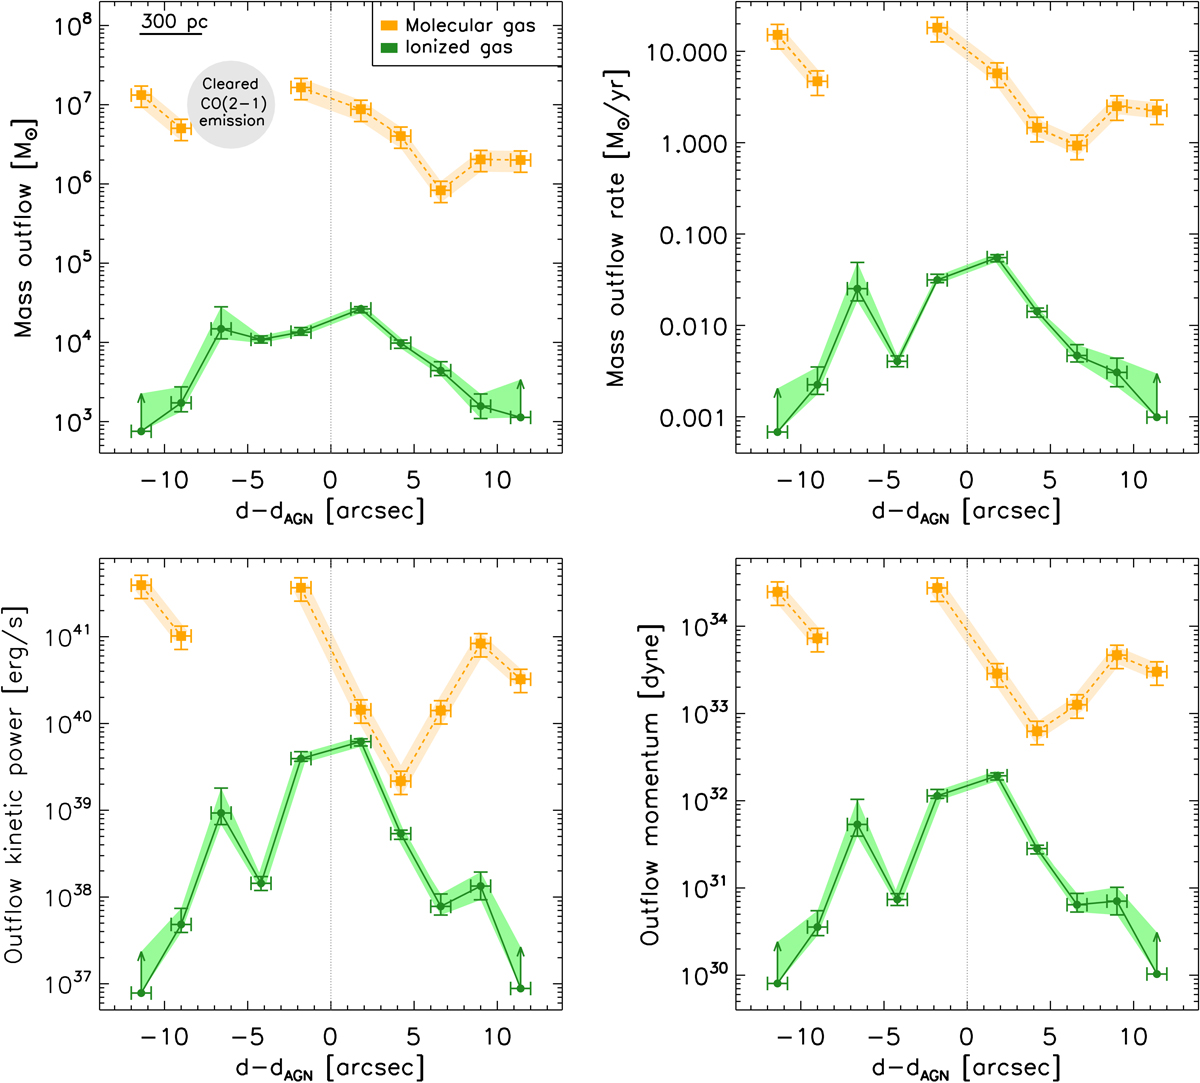
Spatially resolved properties of the ionized (green circles) and molecular (orange squares) phases of the outflow: outflowing mass (top left), mass outflow rate (top right), outflow kinetic power (bottom left), and outflow momentum (bottom right). Orange squares and green circles correspond to the molecular and ionized outflow gas, respectively. The two regions to the east of the AGN (negative d − dAGN values) with no molecular outflow derived properties correspond to regions with cleared CO(2−1) emission.
Current usage metrics show cumulative count of Article Views (full-text article views including HTML views, PDF and ePub downloads, according to the available data) and Abstracts Views on Vision4Press platform.
Data correspond to usage on the plateform after 2015. The current usage metrics is available 48-96 hours after online publication and is updated daily on week days.
Initial download of the metrics may take a while.