Fig. 8.
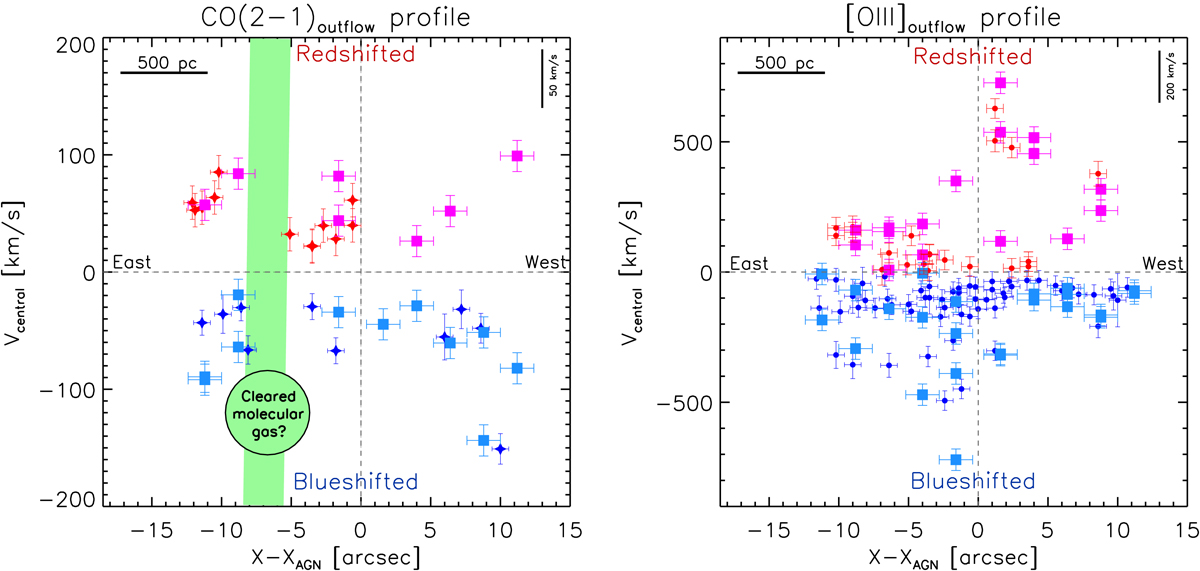
Spatially resolved profile of the central outflow velocities (projected) for CO(2−1) (left) and for [O III] (right). Blue and red symbols correspond to blueshifted and redshifted velocities. For comparison, we also show the central velocities of the slices (pale blue and magenta squares; see Sects. 3.2 and 4, and Appendix A). The black circle indicates the cleared molecular gas region.
Current usage metrics show cumulative count of Article Views (full-text article views including HTML views, PDF and ePub downloads, according to the available data) and Abstracts Views on Vision4Press platform.
Data correspond to usage on the plateform after 2015. The current usage metrics is available 48-96 hours after online publication and is updated daily on week days.
Initial download of the metrics may take a while.