Fig. 7.
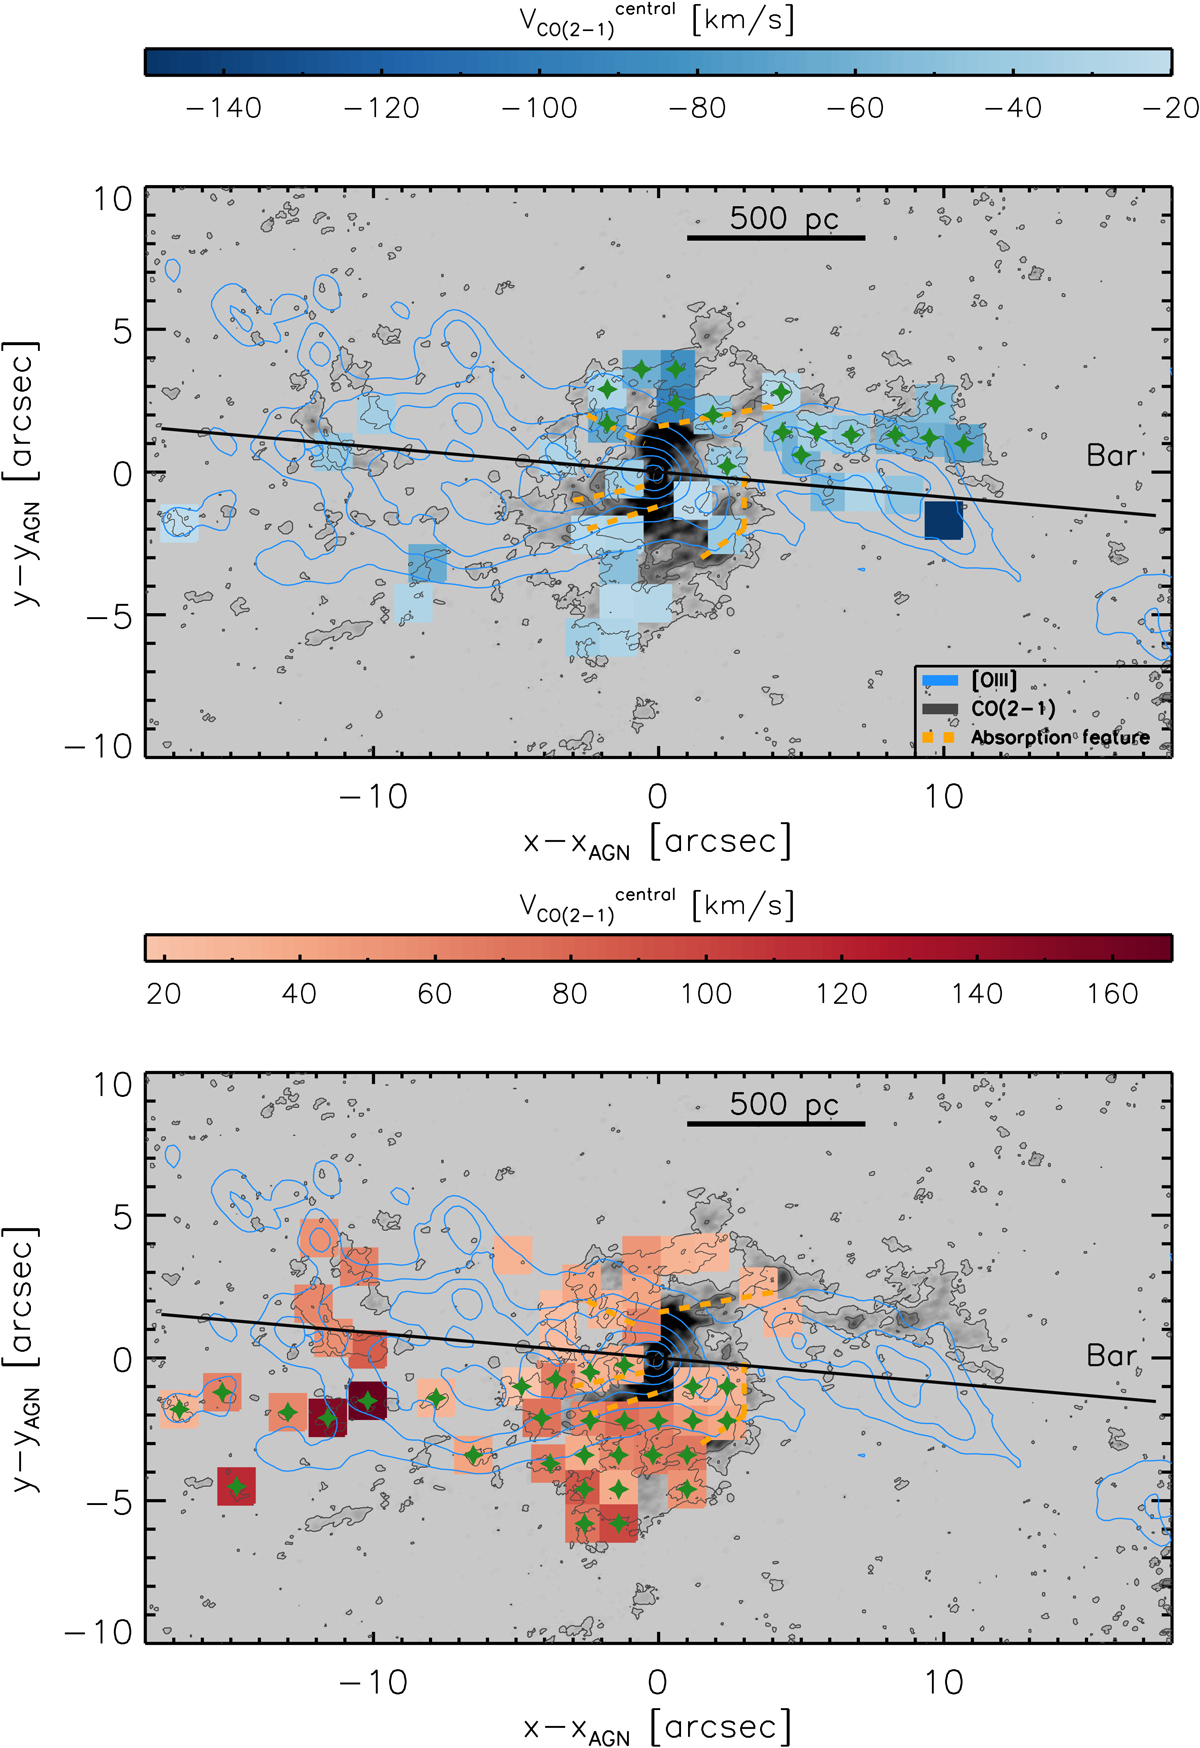
ALMA CO(2−1) integrated intensity map in gray scale. Blue contours show the [O III]λ5007 Å emission (see Sect. 4). The black contours are the CO(2−1) emission on a logarithmic scale with the first contour at 6σ and the last contour at 2.2 × 10⁻¹⁷ erg s−1 cm2 beam−1. The square regions are color-coded according to the central (projected) noncircular velocity in the cold molecular gas phase. Top panel: blueshifted CO(2−1) noncircular Vcentral (projected), and bottom panel: redshifted velocities. The solid black line shows the orientation of the large-scale stellar bar (Mulchaey et al. 1997). Filled green stars mark regions with the expected local inflow regions due to the bar (see Sect. 4.2). The dashed orange lines are the same as in Fig. 6.
Current usage metrics show cumulative count of Article Views (full-text article views including HTML views, PDF and ePub downloads, according to the available data) and Abstracts Views on Vision4Press platform.
Data correspond to usage on the plateform after 2015. The current usage metrics is available 48-96 hours after online publication and is updated daily on week days.
Initial download of the metrics may take a while.