Fig. 6.
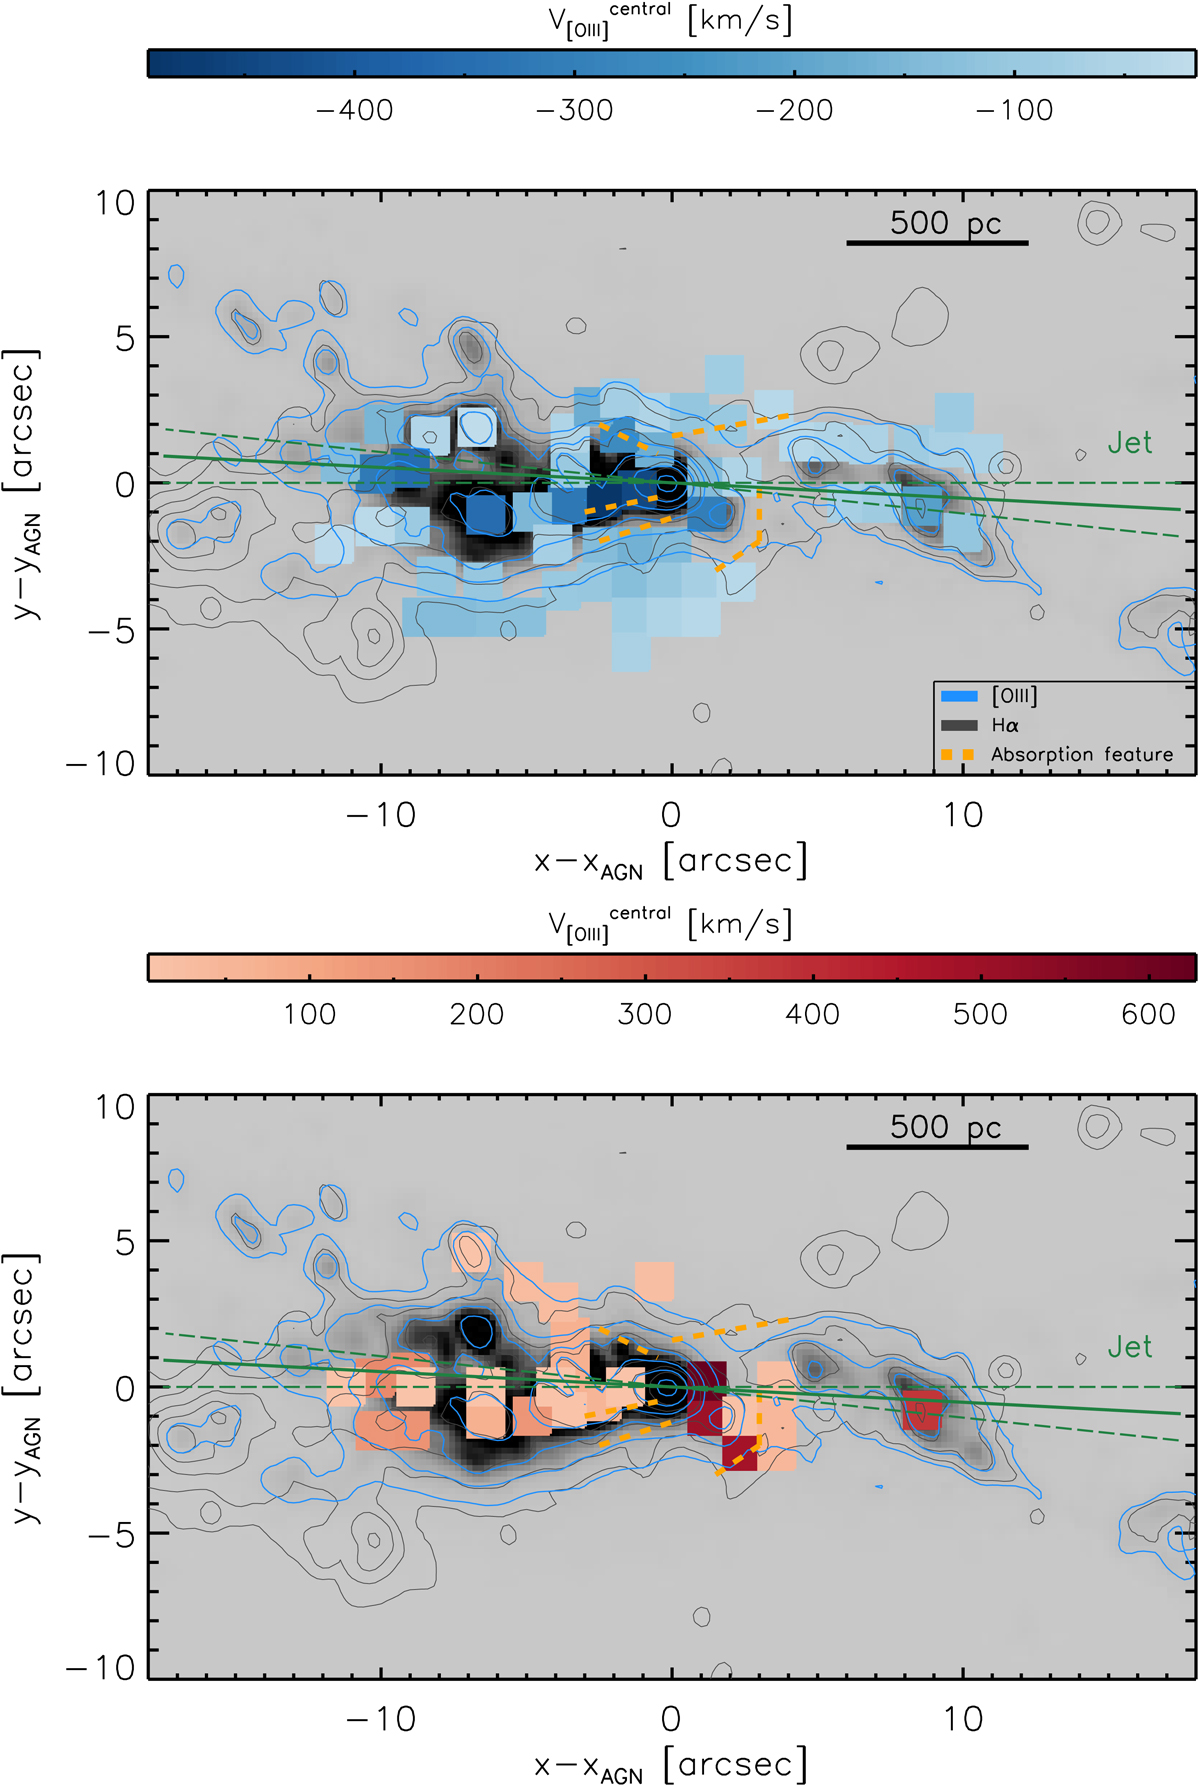
[O III]λ5007 Å integrated intensity map in gray scale. Blue and brown contours show the [O III]λ5007 Å and Hα emission (see Sect. 4). The square regions are color-coded according to the central (projected) outflow velocity in the ionized gas phase. Top panel: blueshifted [O III] outflow vcentral (projected), and bottom panel: redshifted velocities. The solid and dashed green lines correspond to the direction of the radio jet. The dashed orange lines trace the three main absorption features in the dust structure map of Davies et al. (2014). The feature to the southwest may be associated with outflow rather than inflow.
Current usage metrics show cumulative count of Article Views (full-text article views including HTML views, PDF and ePub downloads, according to the available data) and Abstracts Views on Vision4Press platform.
Data correspond to usage on the plateform after 2015. The current usage metrics is available 48-96 hours after online publication and is updated daily on week days.
Initial download of the metrics may take a while.