Fig. 3.
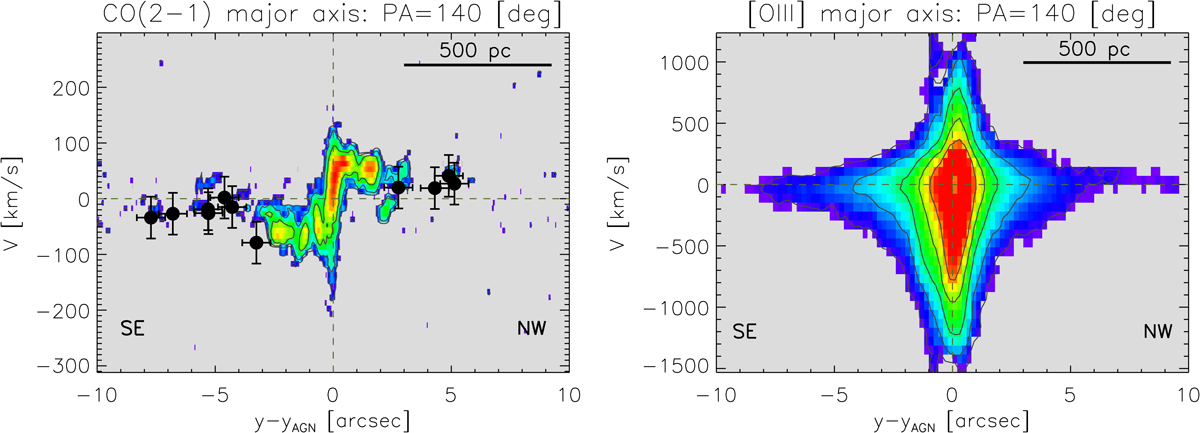
Left panel: observed CO(2−1) p-v diagram along the kinematic major axis (fluxes above 3σ). The black circles correspond to the velocities of the [O III] narrow components along the kinematic major axis. Right panel: same as in the left panel, but for the [O III] emission. The horizontal dashed line indicates the zero velocity, and the vertical line shows the AGN position.
Current usage metrics show cumulative count of Article Views (full-text article views including HTML views, PDF and ePub downloads, according to the available data) and Abstracts Views on Vision4Press platform.
Data correspond to usage on the plateform after 2015. The current usage metrics is available 48-96 hours after online publication and is updated daily on week days.
Initial download of the metrics may take a while.