Fig. 2.
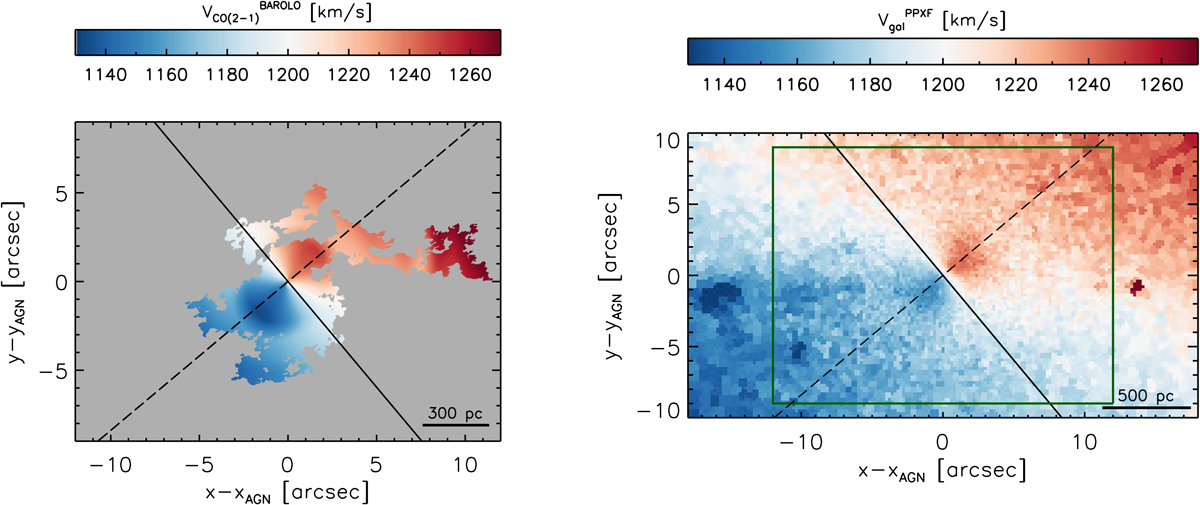
Left panel: 3DBAROLO model of the mean velocity field of NGC 5643 using a rotating-disk model fitted to the natural-weight CO(2−1) data cube. Right panel: penalized pixel-fitting (pPXF) model of the stellar kinematics from the Ca II triplet lines using λ> 8000 Å MUSE data and pixels binned to S/N = 40. The solid and dashed black lines correspond to the kinematic minor and major axes, respectively. The green box in the right panel shows the FoV of the left panel. The northeastern (southwestern) region corresponds to the far (near) side. North is up and east is left, and offsets are measured relative to the AGN.
Current usage metrics show cumulative count of Article Views (full-text article views including HTML views, PDF and ePub downloads, according to the available data) and Abstracts Views on Vision4Press platform.
Data correspond to usage on the plateform after 2015. The current usage metrics is available 48-96 hours after online publication and is updated daily on week days.
Initial download of the metrics may take a while.