Fig. B.1.
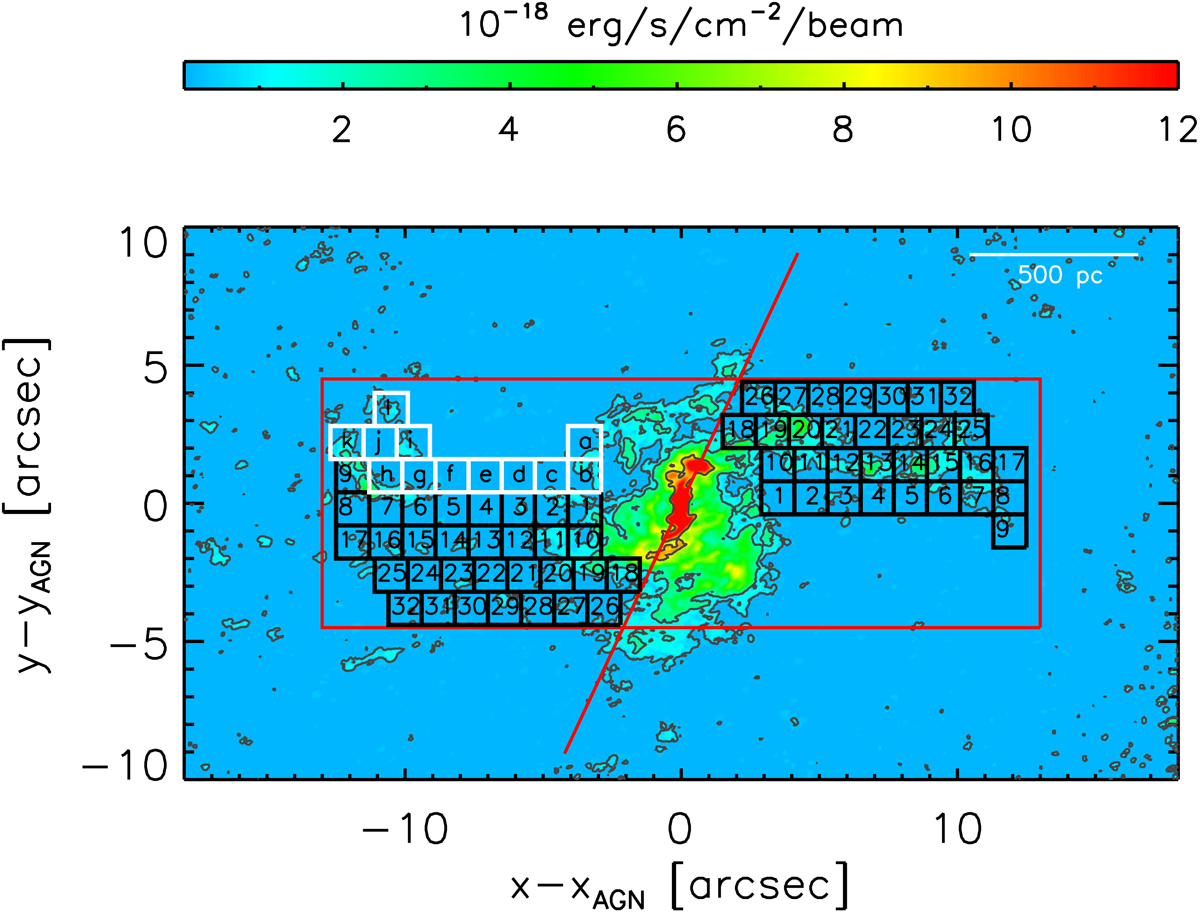
ALMA CO(2−1) integrated-intensity map of NGC 5643 produced from the natural-weight data cube. The map is shown on a linear color scale. Black contours corresponds to the CO(2−1) emission map. They are shown on a logarithmic scale with the first contour at 8σ and the last contour at 2.2 × 10⁻¹⁷ erg s−1 cm2 beam−1. The various boxes correspond to the regions we selected to measure the two main spiral arms (see Sect. 5.3). Black boxes indicate regions that were selected as symmetric at either side of the nucleus. White boxes correspond to the supplementary regions to take additional individual CO(2−1) clumps into account. The diagonal solid red line indicates the separation axis between the two arms. North is up and east is left, and offsets are measured relative to the AGN.
Current usage metrics show cumulative count of Article Views (full-text article views including HTML views, PDF and ePub downloads, according to the available data) and Abstracts Views on Vision4Press platform.
Data correspond to usage on the plateform after 2015. The current usage metrics is available 48-96 hours after online publication and is updated daily on week days.
Initial download of the metrics may take a while.