Fig. A.3.
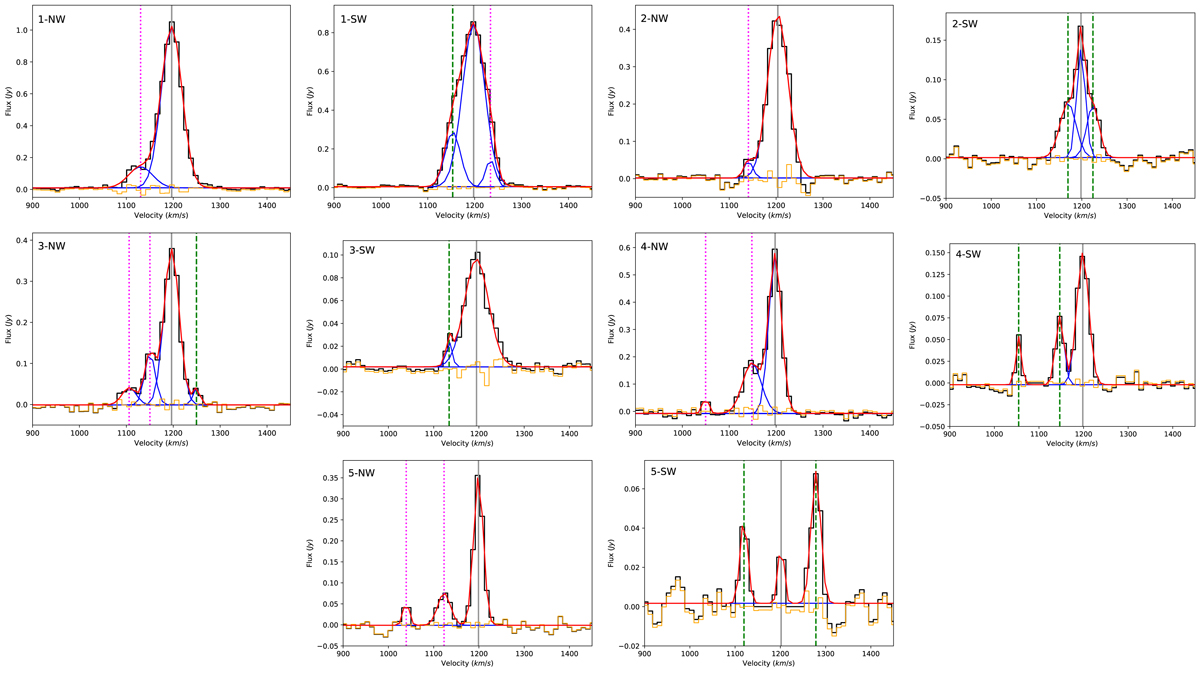
Molecular CO(2−1) emission-line fitting for the stacked spectra in each slice. Left to right panels: western regions 1, 2, 3, 4, and 5. The vertical solid gray line corresponds to the systemic component, the dashed green and dotted pink lines show the components that are identified as outflows and inflows, respectively. The solid orange line corresponds to the fit residuals.
Current usage metrics show cumulative count of Article Views (full-text article views including HTML views, PDF and ePub downloads, according to the available data) and Abstracts Views on Vision4Press platform.
Data correspond to usage on the plateform after 2015. The current usage metrics is available 48-96 hours after online publication and is updated daily on week days.
Initial download of the metrics may take a while.