Fig. A.1.
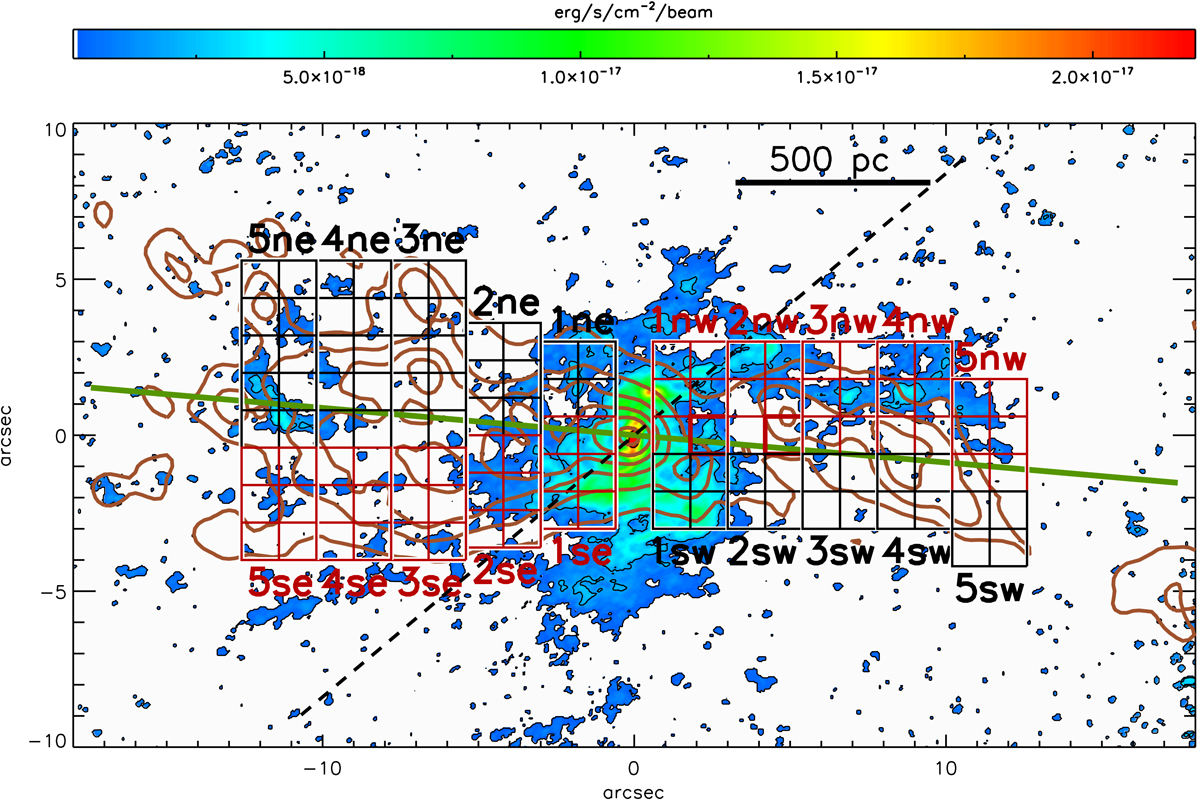
ALMA CO(2−1) integrated intensity map of NGC 5643 produced from the natural-weight data cube. The map is shown on a linear color scale. Black contours corresponds to the CO(2−1) emission map. They are shown on a logarithmic scale with the first contour at 3σ and the last contour at 2.2 × 10⁻¹⁷ erg s−1 cm2 beam−1. Brown contours correspond to the [O III]λ5007 Å emission map (see Sect. 4). The dashed black line indicates the kinematic major axis. The solid green line corresponds to the direction of the large-scale stellar bar (Mulchaey et al. 1997). Red and black boxes correspond to regions where streaming motions (local inflow) are expected and are not expected, respectively. For instance, region 5ne consists of 2 × 5 black boxes (1.2″ × 1.2″ square apertures), and the eastern 5 full slice corresponds to 5ne+5se.
Current usage metrics show cumulative count of Article Views (full-text article views including HTML views, PDF and ePub downloads, according to the available data) and Abstracts Views on Vision4Press platform.
Data correspond to usage on the plateform after 2015. The current usage metrics is available 48-96 hours after online publication and is updated daily on week days.
Initial download of the metrics may take a while.