Fig. 12.
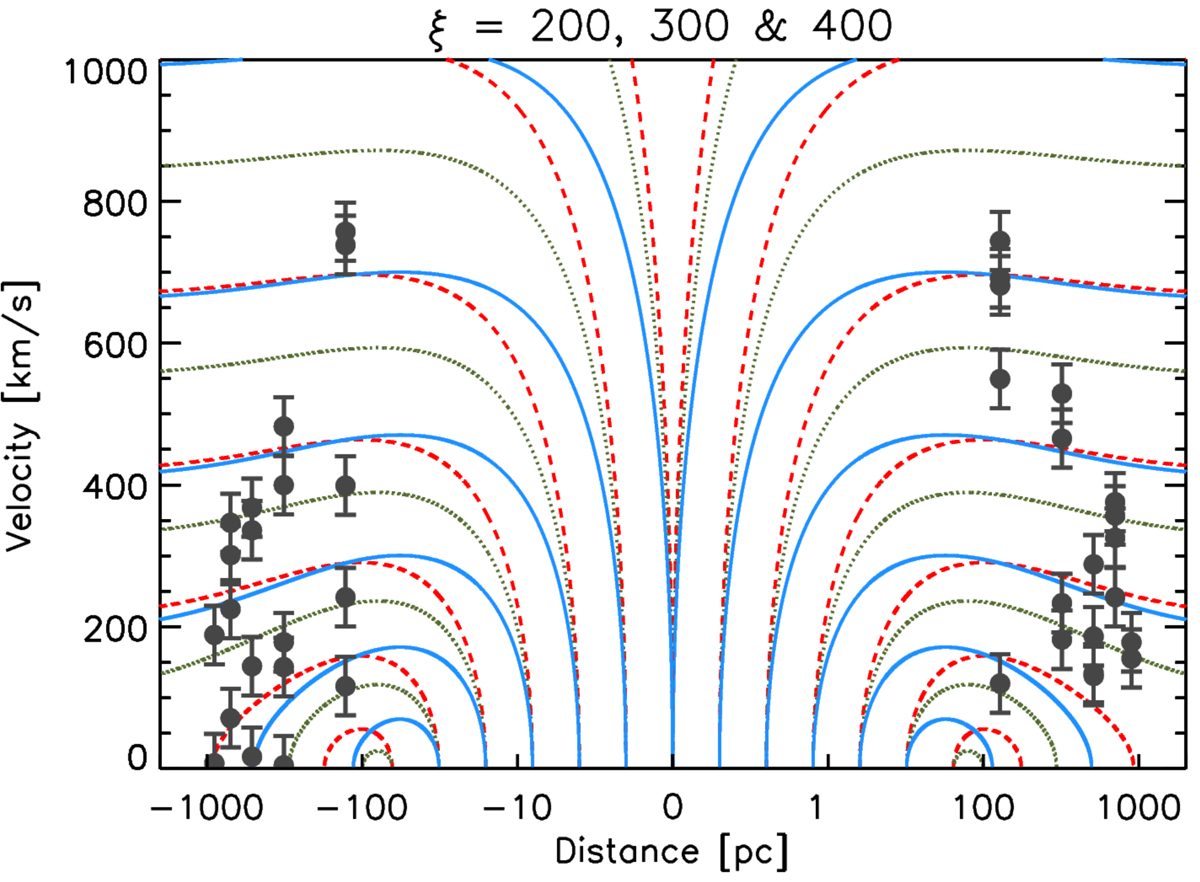
Outflow wind analytic model: velocity profiles for various force multipliers (ξ = 200, 300, and 400) and launch radii (r1 = 1, 2, 4, 8, 16, 32, and 64 pc). Lines correspond to the various force multipliers used (ξ = 200 solid blue, 300 dotted green, and 400 dashed red). Black circles correspond to the deprojected velocities of the ionized outflow. Negative (positive) distances indicate eastern (western) radial distances to the AGN.
Current usage metrics show cumulative count of Article Views (full-text article views including HTML views, PDF and ePub downloads, according to the available data) and Abstracts Views on Vision4Press platform.
Data correspond to usage on the plateform after 2015. The current usage metrics is available 48-96 hours after online publication and is updated daily on week days.
Initial download of the metrics may take a while.