Fig. 10.
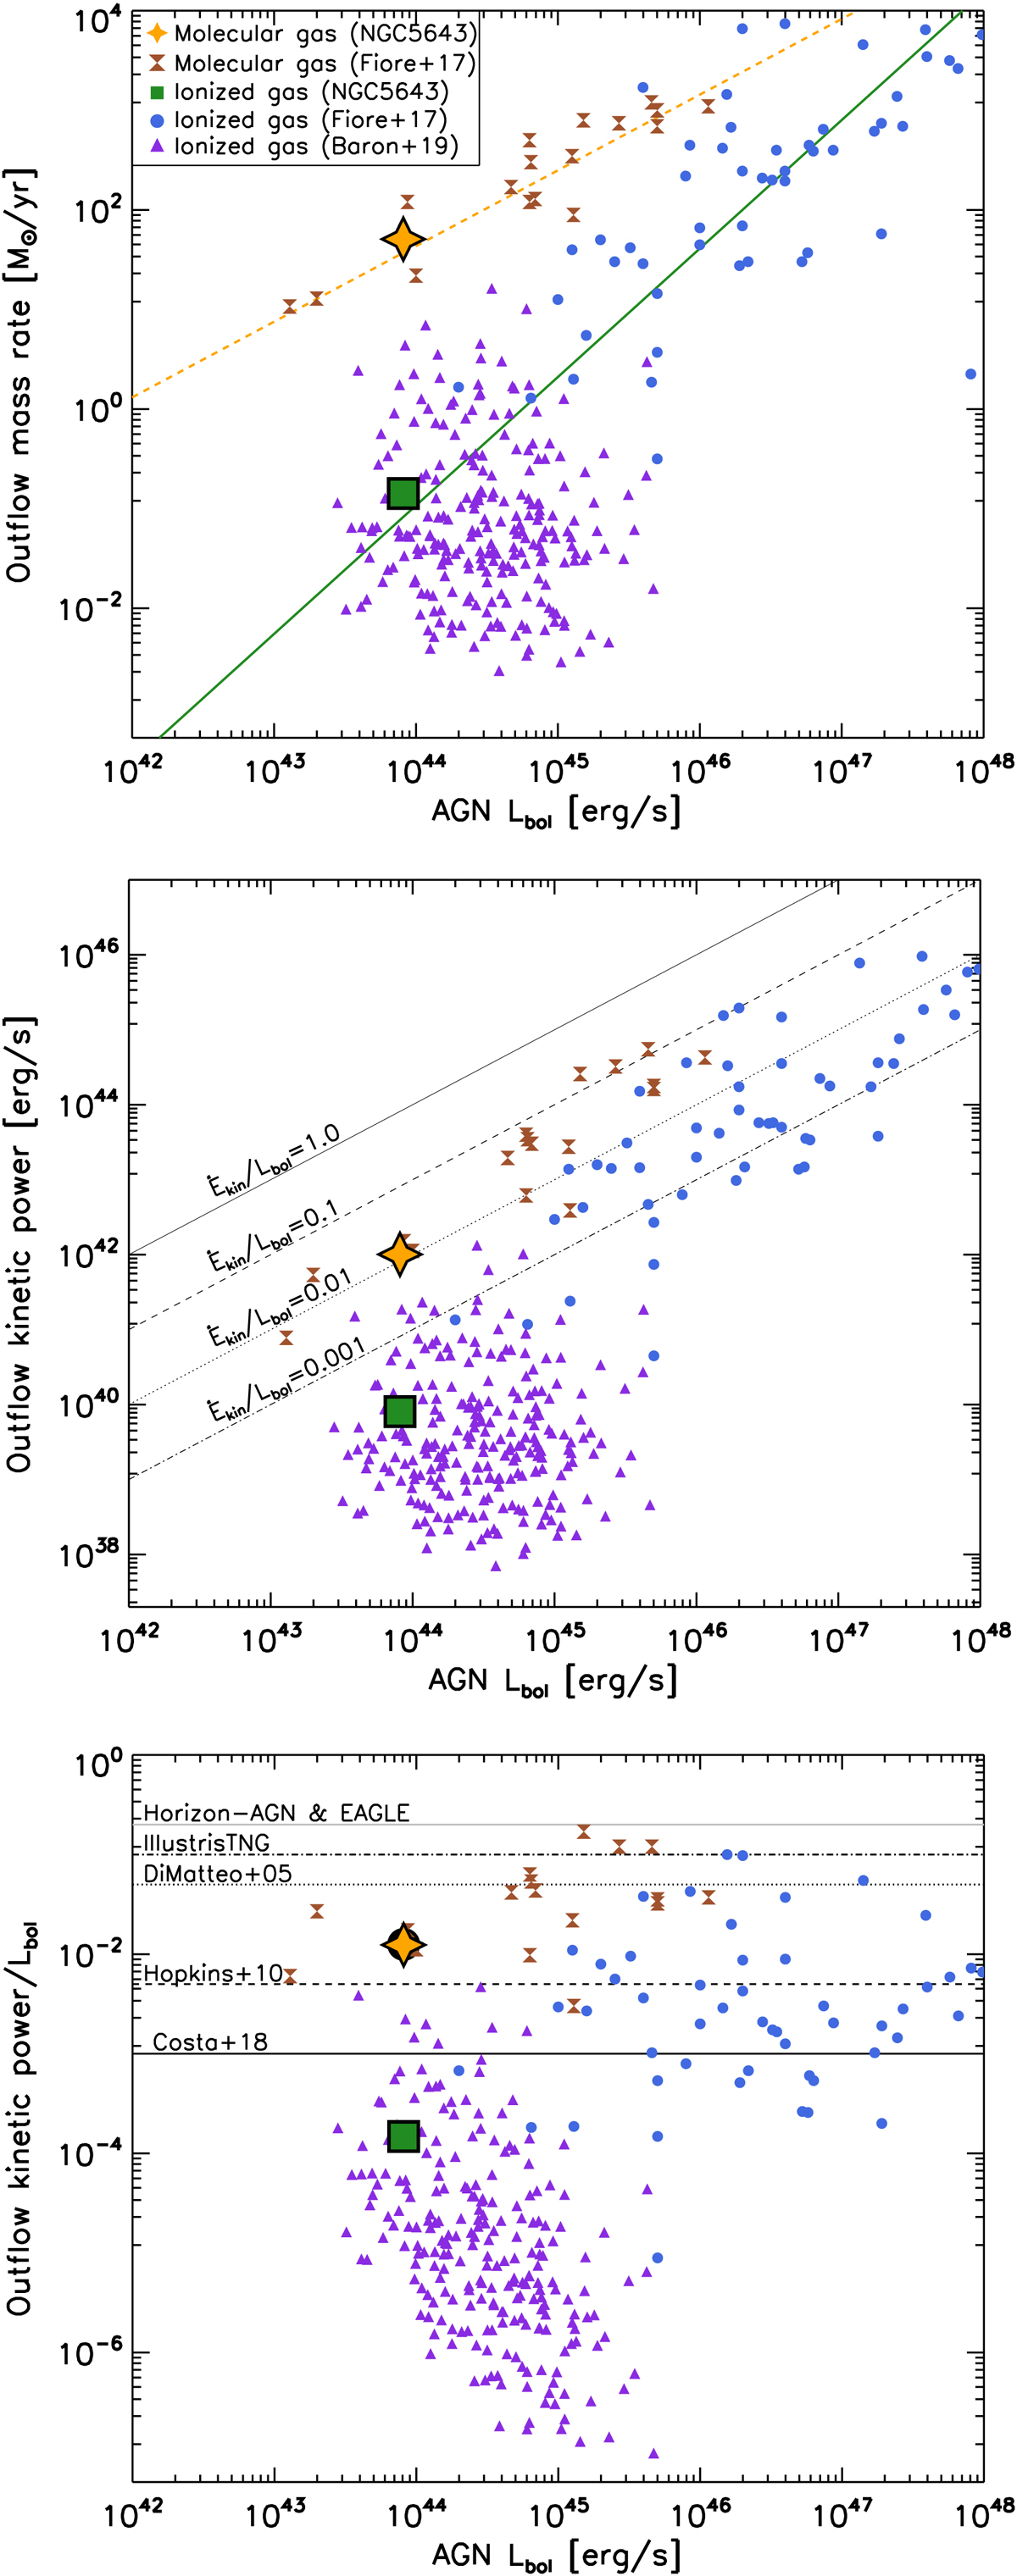
Total outflow properties. Top panel: outflow mass rate as a function of the AGN luminosity. The dashed orange and solid green lines are the best-fit correlations derived by Fiore et al. (2017) for the molecular and ionized gas, respectively. Middle panel: same as top panel, but for the outflow kinetic power. Solid, dashed, dotted, and dash-dotted lines represent Ėkin = 1.0,0.1,0.01,0.001 Lbol. Bottom panel: kinetic coupling efficiencies. The various horizontal lines correspond to theoretical values (Costa et al. 2018; Di Matteo et al. 2005; Dubois et al. 2014; Hopkins & Elvis 2010; Schaye et al. 2015; Weinberger et al. 2017). Orange stars and green squares represent the values derived in this work for the molecular and ionized phase of NGC 5643, respectively. The black circle shows the total kinetic coupling efficiencies for both (ionzed and molecular) gas phases. The brown hourglass and blue circles are taken from Fiore et al. (2017) for the molecular and ionized phase, respectively, and the purple triangles are adopted from Baron & Netzer (2019) for ionized outflows. We have consistently applied the same method as in Fiore et al. (2017) for the total ionized gas mass, as ![]() .
.
Current usage metrics show cumulative count of Article Views (full-text article views including HTML views, PDF and ePub downloads, according to the available data) and Abstracts Views on Vision4Press platform.
Data correspond to usage on the plateform after 2015. The current usage metrics is available 48-96 hours after online publication and is updated daily on week days.
Initial download of the metrics may take a while.