Fig. 1.
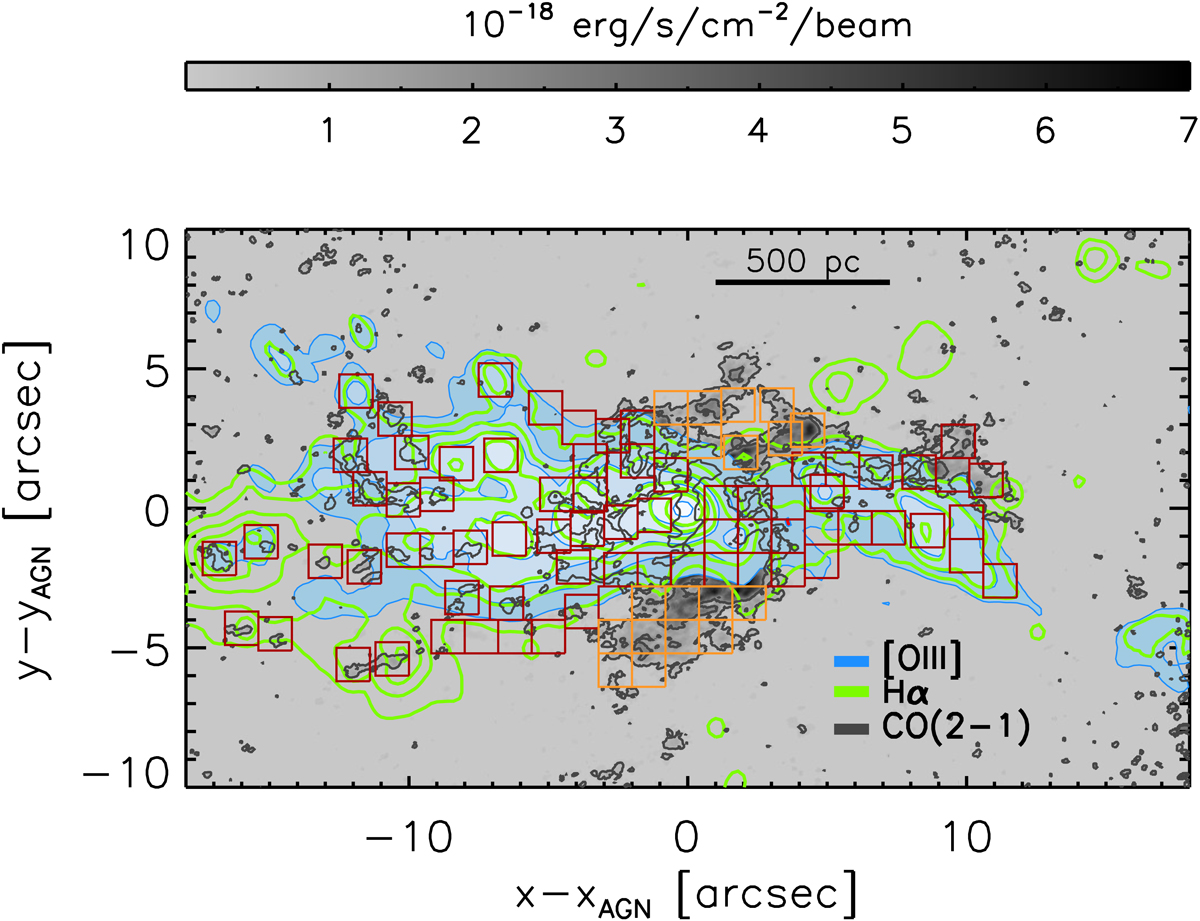
ALMA CO(2−1) integrated intensity map of NGC 5643 in gray scale, produced from the natural-weight data cube on a linear scale. The black contours are the CO(2−1) emission on a logarithmic scale. The first contour lies at 8σ and the last contour at 8.7 × 10⁻¹⁸ erg s−1 cm2 beam−1. Filled blue and green contours are the MUSE [O III]λ5007 Å and Hα emission maps (see Sect. 4), respectively. Red and orange regions correspond to the outflow and nuclear spiral selected zones, respectively. North is up and east is left, and offsets are measured relative to the AGN.
Current usage metrics show cumulative count of Article Views (full-text article views including HTML views, PDF and ePub downloads, according to the available data) and Abstracts Views on Vision4Press platform.
Data correspond to usage on the plateform after 2015. The current usage metrics is available 48-96 hours after online publication and is updated daily on week days.
Initial download of the metrics may take a while.