Fig. 6.
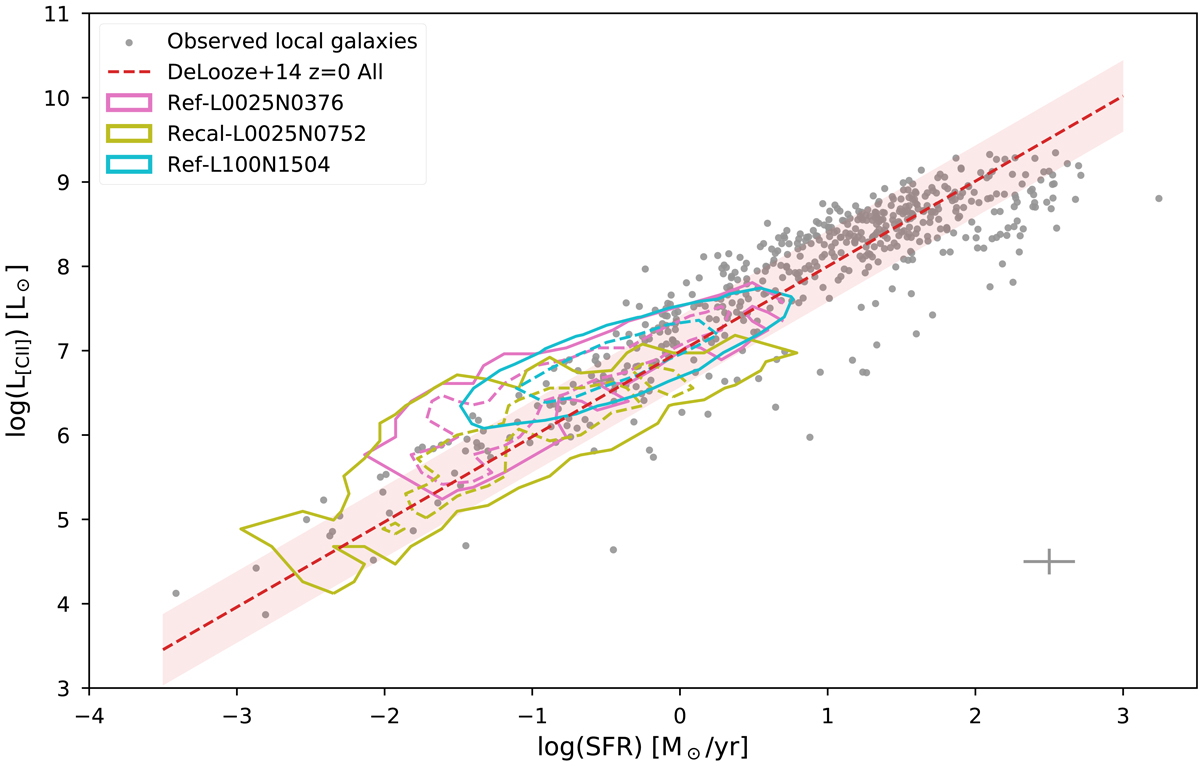
L[C II–SFR relation for the three simulations used in this work (REF-L0025N0376, RECAL-L0025N0752, and REF-L0100N1504) presented as contour maps (pink, olive and cyan, respectively) and an observational sample of local galaxies (grey dots, briefly described in Appendix A). The contours shows where 90% (solid) and 50% (dashed) of the galaxies of the respective simulations fall in the relation. The sample of local galaxies is a compilation of different surveys containing main sequence galaxies (Brauher et al. 2008, ISO Compendium), starburst galaxies (Díaz-Santos et al. 2013, 2017, GOALS), dwarf galaxies (Cormier et al. 2015, 2019, HDGS), star-forming, AGN and LIRG galaxies (Herrera-Camus et al. 2018b,a, SHINING), dusty main sequence galaxies (Hughes et al. 2017, VALES) and intermediate-stellar-mass galaxies (Accurso et al. 2017, xCOLD GASS). We present the mean error from the observational samples in the bottom-right corner of the plot. The dashed red line is the power law derived by De Looze et al. (2014) for the relation at z = 0, with the shaded red region representing the 1σ scatter.
Current usage metrics show cumulative count of Article Views (full-text article views including HTML views, PDF and ePub downloads, according to the available data) and Abstracts Views on Vision4Press platform.
Data correspond to usage on the plateform after 2015. The current usage metrics is available 48-96 hours after online publication and is updated daily on week days.
Initial download of the metrics may take a while.