Fig. D.2
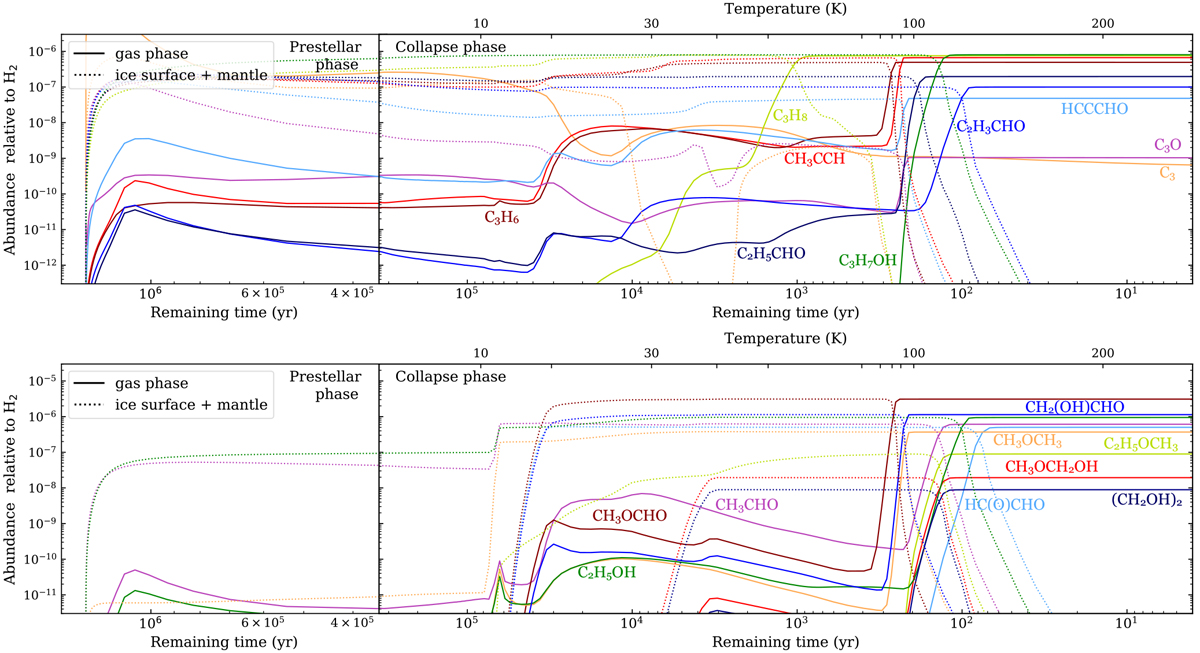
Evolution of the abundances of three-carbon species during the prestellar and the collapse phase of the simulation run A2. Thetime axis is reversed to better visualise the abundance evolution. Each color corresponds to a single species, with its abundance in the gas phase and on grain surfaces shown in solid and dotted lines, respectively.
Current usage metrics show cumulative count of Article Views (full-text article views including HTML views, PDF and ePub downloads, according to the available data) and Abstracts Views on Vision4Press platform.
Data correspond to usage on the plateform after 2015. The current usage metrics is available 48-96 hours after online publication and is updated daily on week days.
Initial download of the metrics may take a while.