Free Access
Fig. A.1
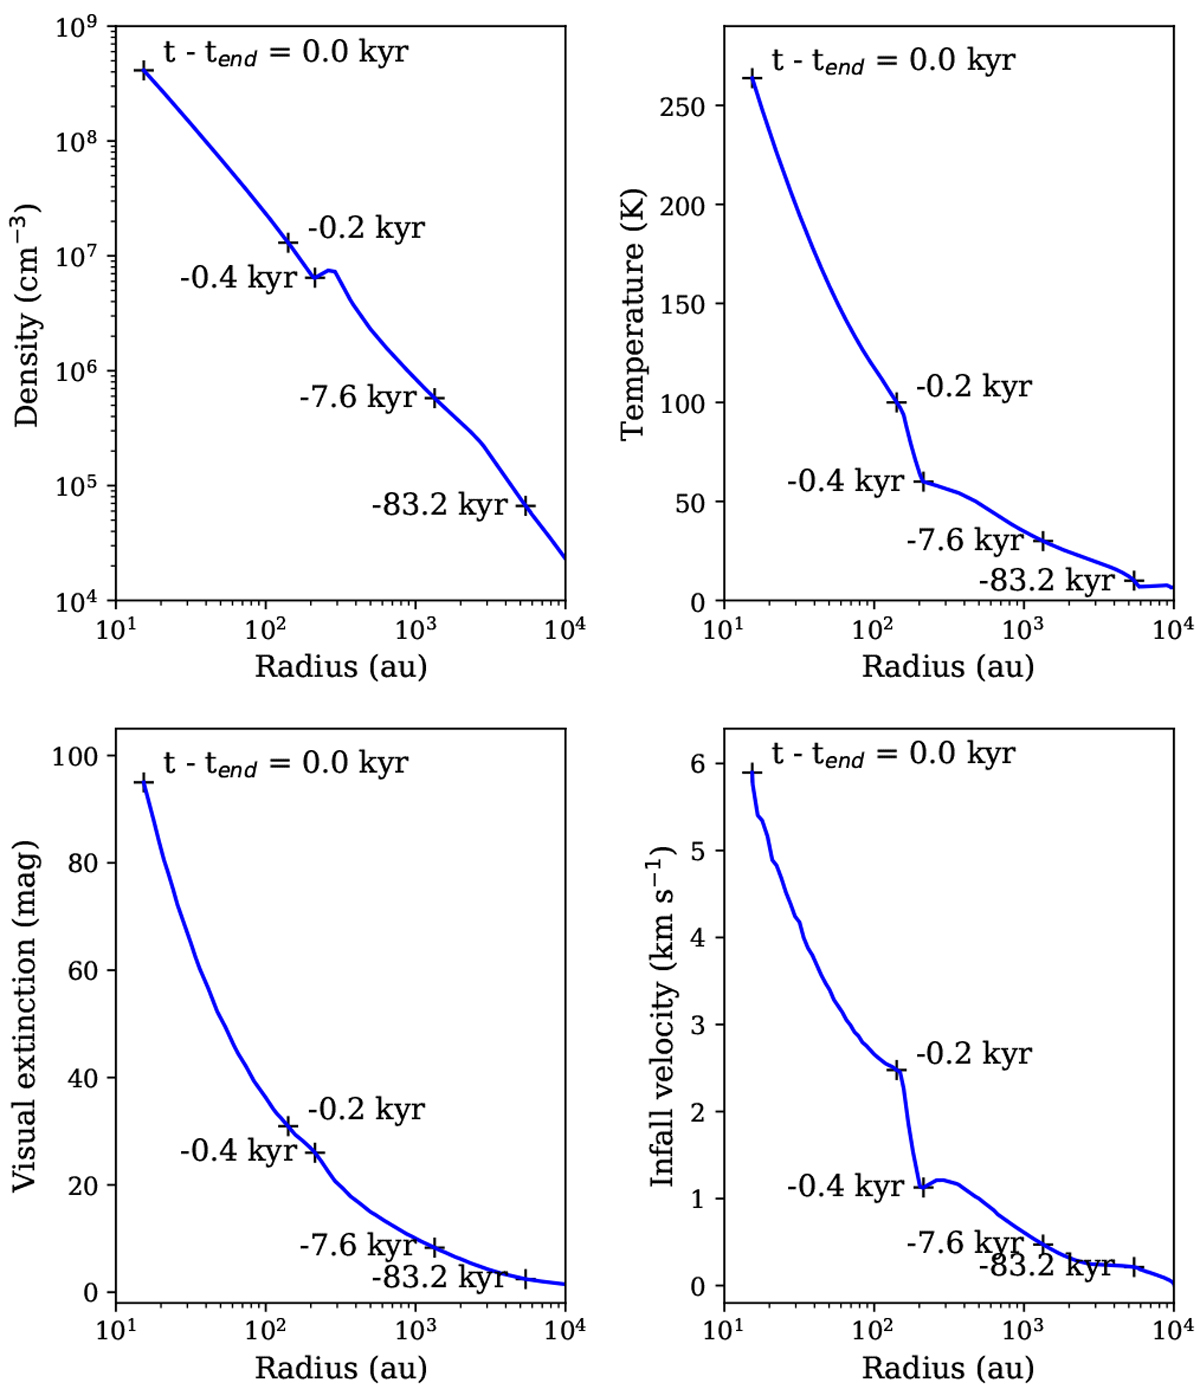
Evolution of the density, dust temperature, visual extinction and infall velocity across the envelope during the simulation. The time is indicated at several positions on the curves, with t = 0 yr set to the end of the collapse phase in the simulation.
Current usage metrics show cumulative count of Article Views (full-text article views including HTML views, PDF and ePub downloads, according to the available data) and Abstracts Views on Vision4Press platform.
Data correspond to usage on the plateform after 2015. The current usage metrics is available 48-96 hours after online publication and is updated daily on week days.
Initial download of the metrics may take a while.