Fig. 6
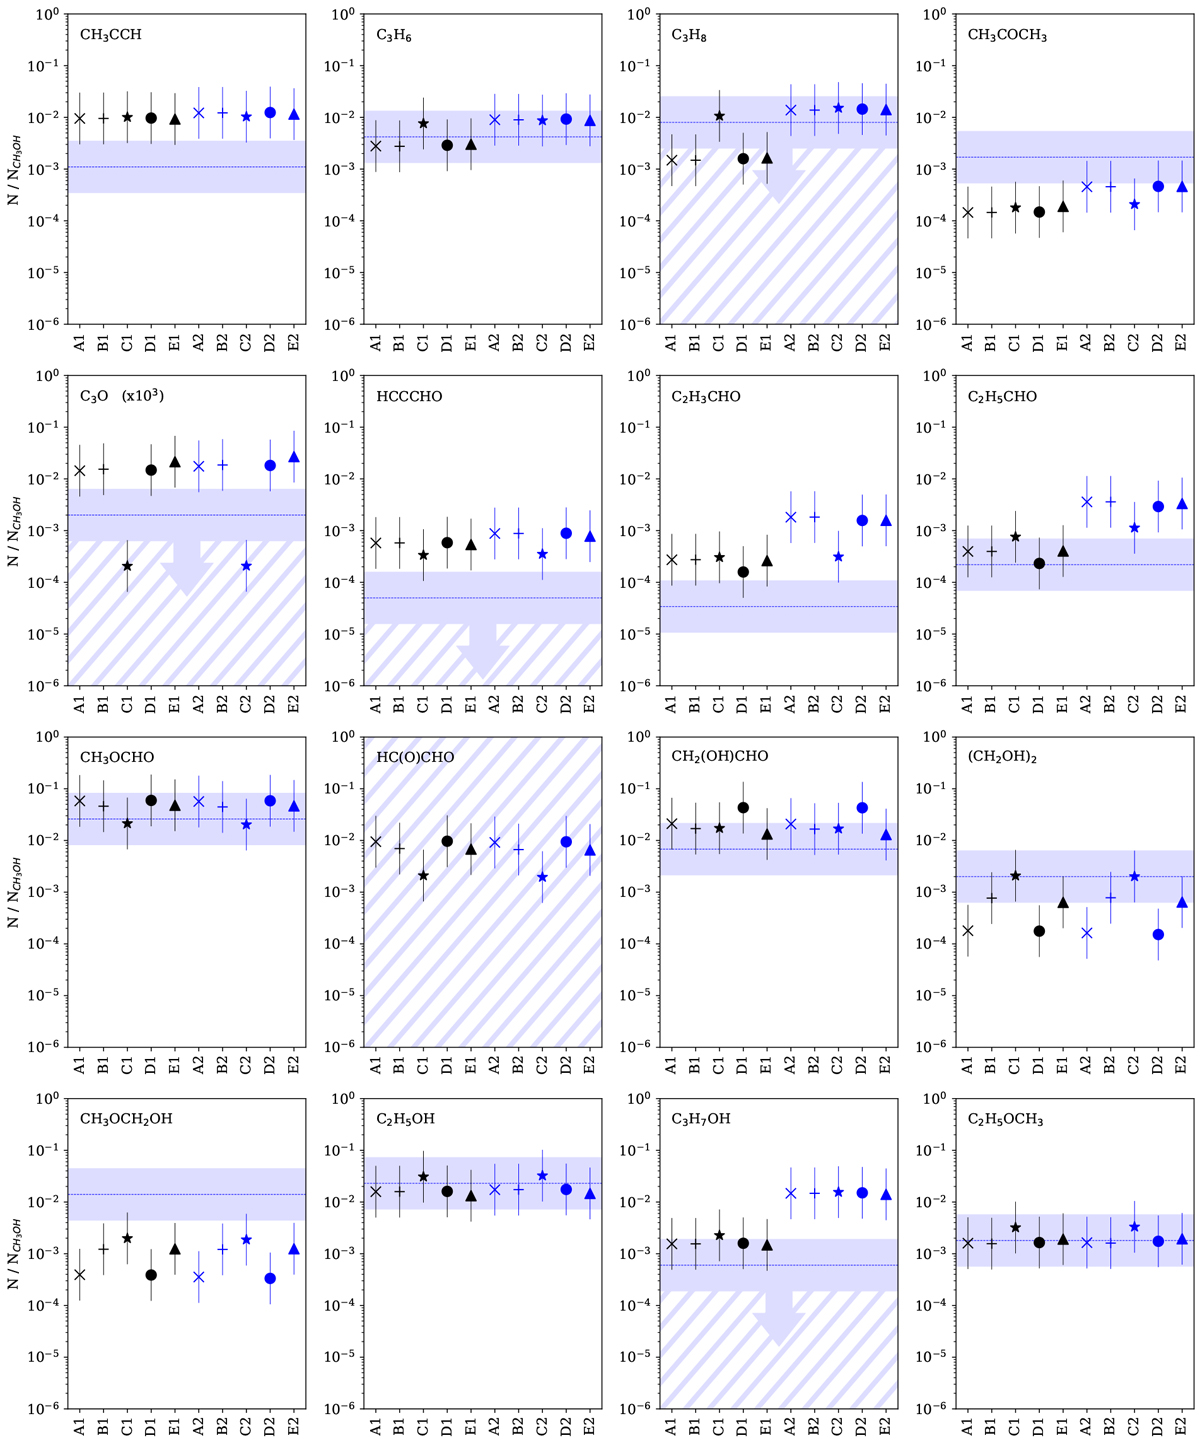
Final abundances reached at the end of each simulation run for the targeted species. The dashed blue line shows the observed abundance of the species towards IRAS 16293B. The error bars and the blue area correspond to one half order of magnitude confidence limit, thus a 1σ-difference between observations and simulations corresponds to one order of magnitude. The dashed blue region represents the abundance values that are consistent with the corresponding upper limit. The abundance scale of C3 O is lower than the other plots. The abundance upper limit of HC(O)CHO is < 2.6 × 10⁴ relative to CH3OH, therefore, there is no observational constraint on the abundance of HC(O)CHO. The abundance upper limit of C3 H7OH is the sum of n-C3H7OH and i-C3H7OH abundance upper limits.
Current usage metrics show cumulative count of Article Views (full-text article views including HTML views, PDF and ePub downloads, according to the available data) and Abstracts Views on Vision4Press platform.
Data correspond to usage on the plateform after 2015. The current usage metrics is available 48-96 hours after online publication and is updated daily on week days.
Initial download of the metrics may take a while.