Fig. 5
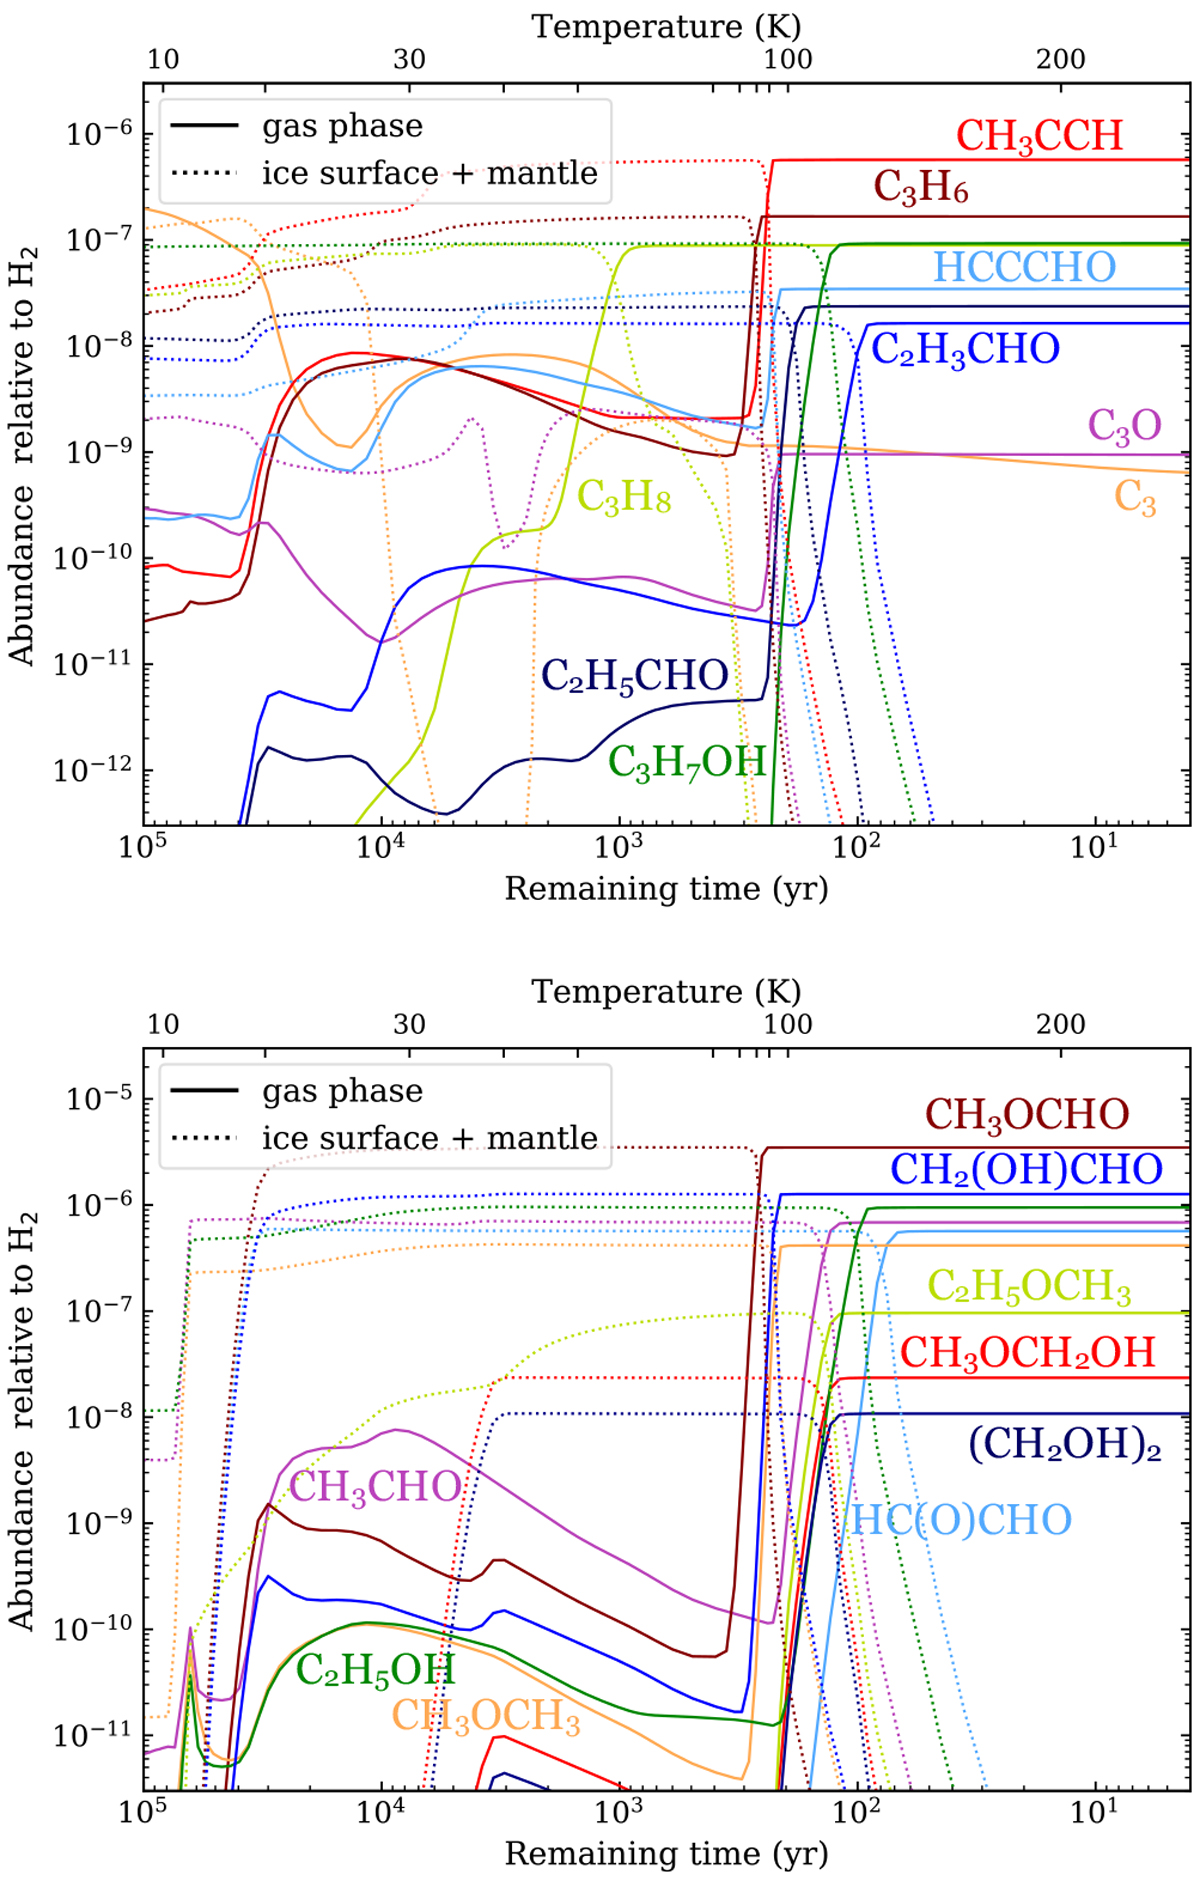
Time evolution of abundances in the gas phase (solid lines) and on the grain surface (dotted) of several species during the collapse phase of the A1 run. The time axis is reversed to better visualise the abundances evolution. Both panels show the results of the same simulation but with a different selection of species, with their name annotated following the colour code of the curves.
Current usage metrics show cumulative count of Article Views (full-text article views including HTML views, PDF and ePub downloads, according to the available data) and Abstracts Views on Vision4Press platform.
Data correspond to usage on the plateform after 2015. The current usage metrics is available 48-96 hours after online publication and is updated daily on week days.
Initial download of the metrics may take a while.