Fig. 3
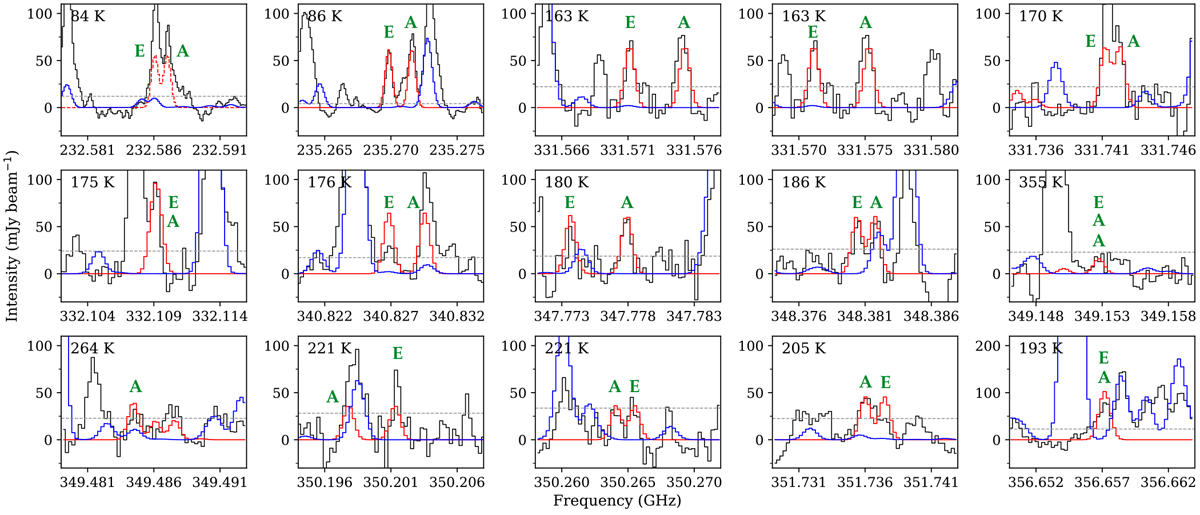
Identified lines of C3H6: the synthetic spectrum, in red, is plotted along with the offset position spectrum towards IRAS 16293B. The dashed lines correspond to optically thick lines. The straight dashed black line represents the detection limit at the intensity of 3σ. The upper-level energy of the transition is noted in the upper left corner of each panel. The torsional state “E” or “A” of each transition is noted in green on the spectra. The reference spectrum in blue takes the previous species reported in PILS into account (see Fig. 2 and references therein).
Current usage metrics show cumulative count of Article Views (full-text article views including HTML views, PDF and ePub downloads, according to the available data) and Abstracts Views on Vision4Press platform.
Data correspond to usage on the plateform after 2015. The current usage metrics is available 48-96 hours after online publication and is updated daily on week days.
Initial download of the metrics may take a while.