Fig. 1
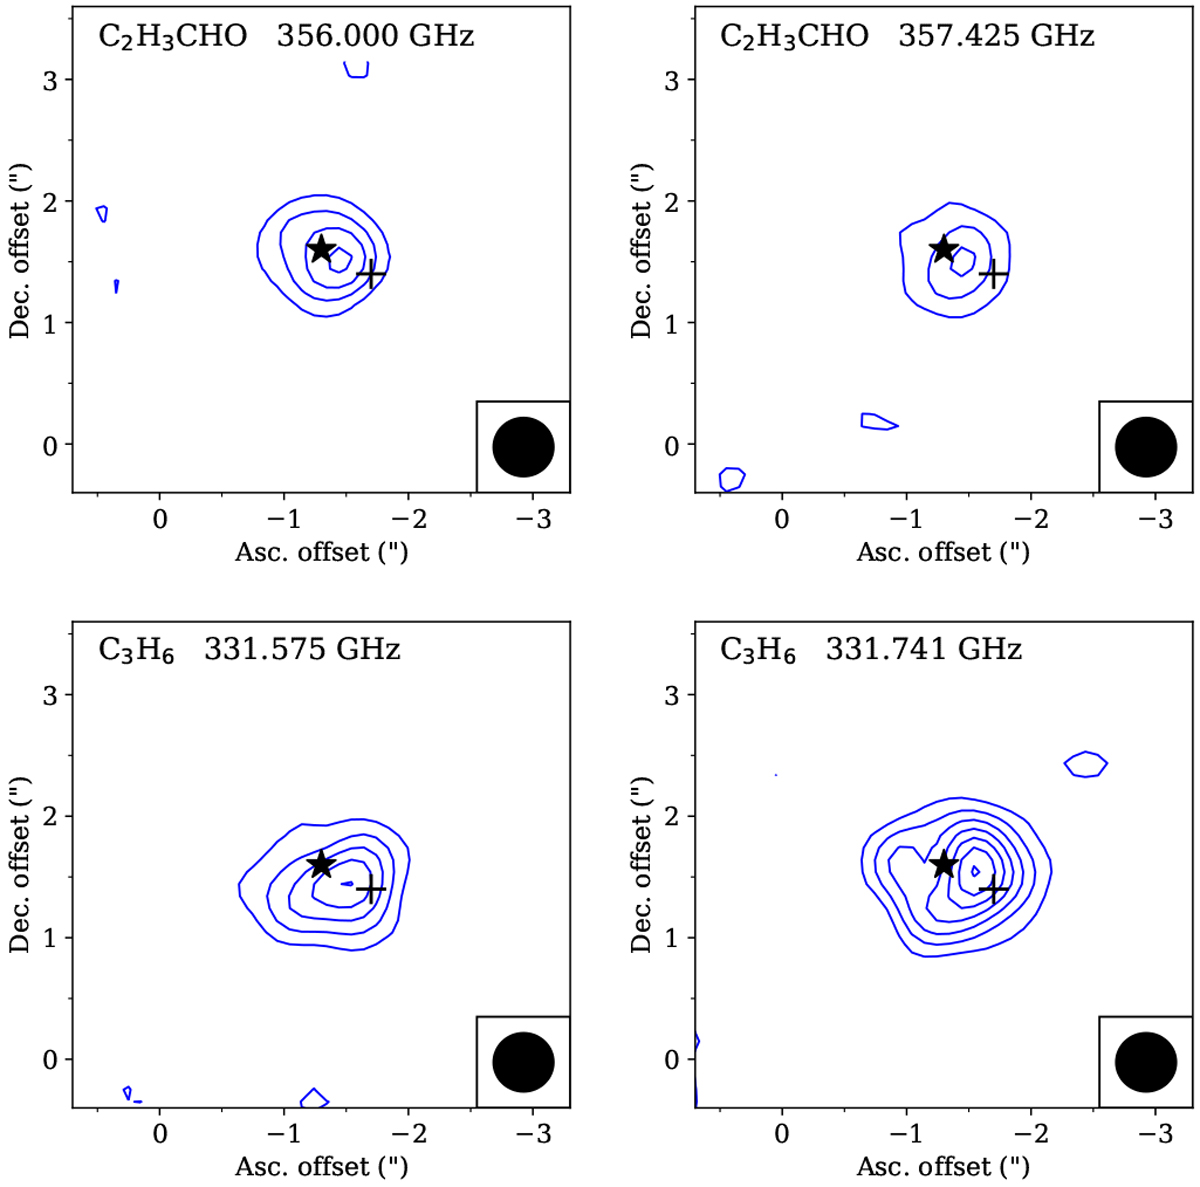
Integrated intensity maps of the line emission for C3H6 and C2 H3CHO, summed over ± 0.5 MHz. The locations of IRAS 16293B continuum peak and the offset position are marked by the black star and plus sign, respectively. The blue contours start at 4σ and increase by steps of 4σ, where σ is 5 mJy beam−1 km s−1 for the integrated intensity. A representative beam of 0′′.5 is shown in the lower right corner of each panel.
Current usage metrics show cumulative count of Article Views (full-text article views including HTML views, PDF and ePub downloads, according to the available data) and Abstracts Views on Vision4Press platform.
Data correspond to usage on the plateform after 2015. The current usage metrics is available 48-96 hours after online publication and is updated daily on week days.
Initial download of the metrics may take a while.