Fig. 6
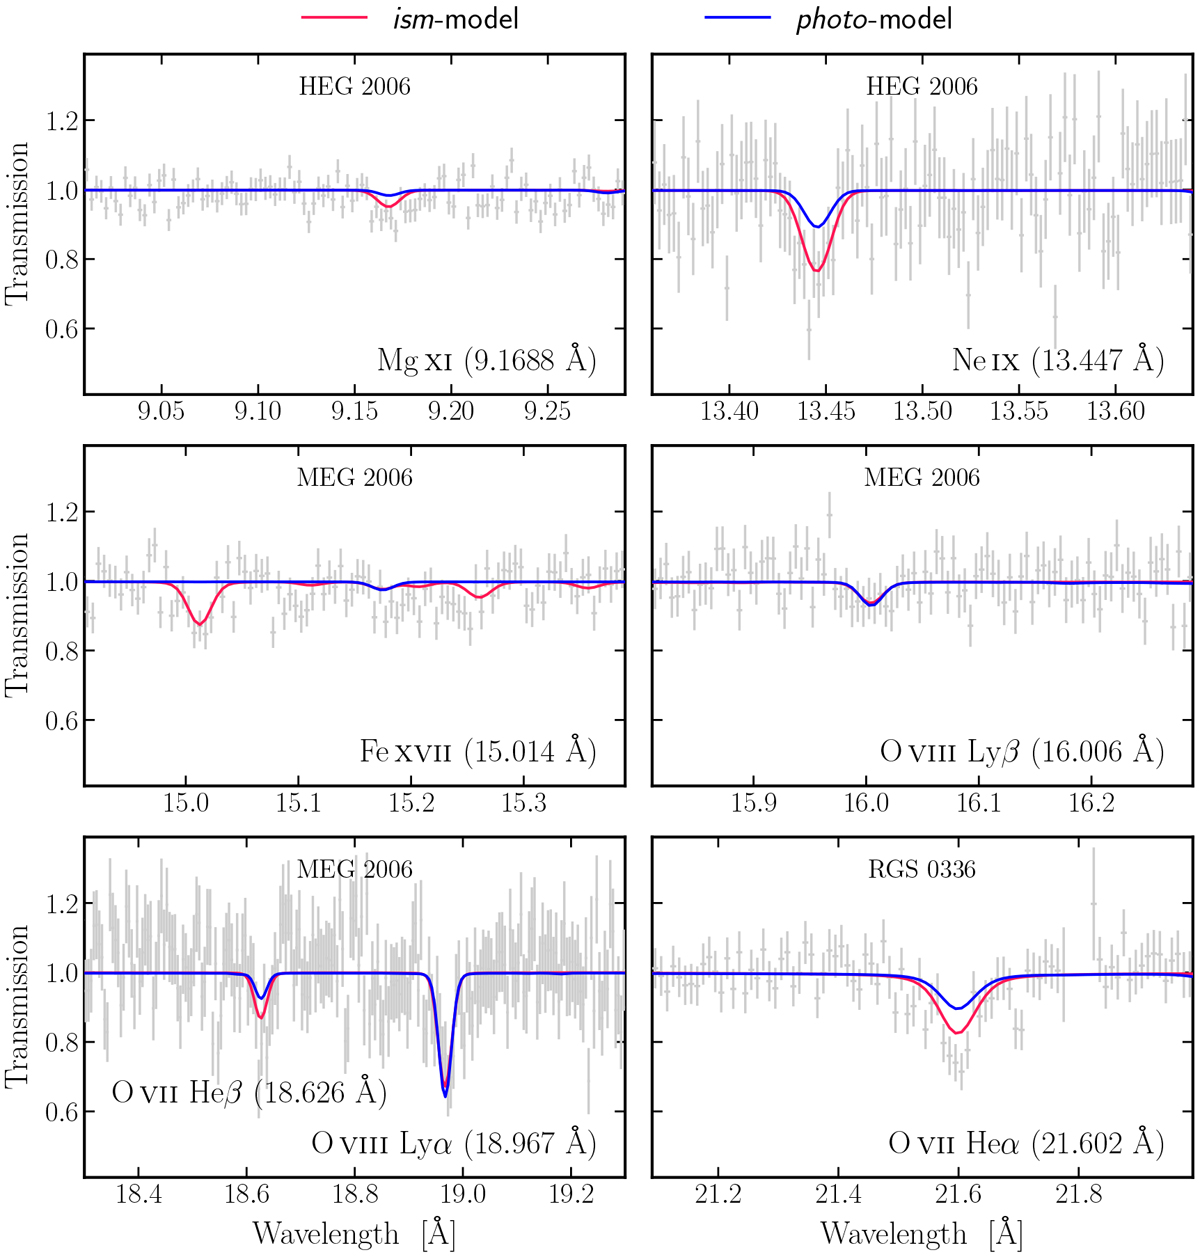
High-ionisation lines detected in the spectra of 4U 1820-30. Here, the spectrum is shown in units of transmittance: the observed counts are divided by the underlying continuum together with the cold and warm absorption. For clarity, we do not display all the datasets. We superimpose the ism and photo models (in red and blue, respectively) obtained with the Bayesian parameter inference.
Current usage metrics show cumulative count of Article Views (full-text article views including HTML views, PDF and ePub downloads, according to the available data) and Abstracts Views on Vision4Press platform.
Data correspond to usage on the plateform after 2015. The current usage metrics is available 48-96 hours after online publication and is updated daily on week days.
Initial download of the metrics may take a while.