Fig. 2
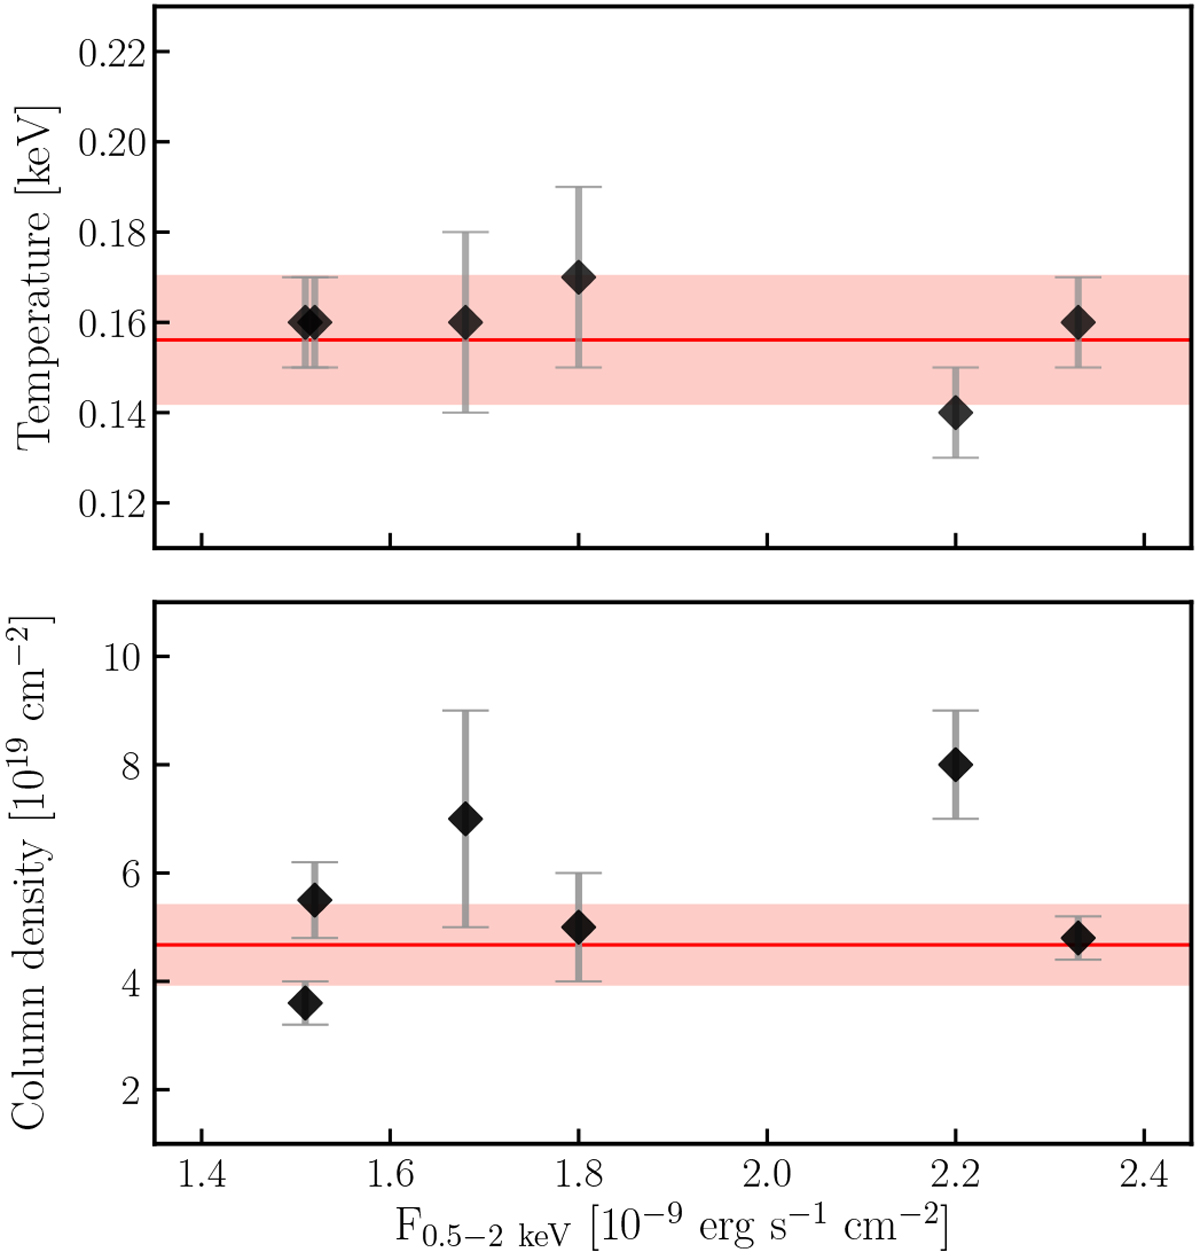
Temperature and hydrogen column density of the ism-model versus the 0.5−2 keV unabsorbed flux for each dataset using the C-statistic fitting model. The horizontal red line represents the inverse-variance-weighted average and the coloured band indicates the 3σ confidence band. Only RGS 008411 (the observation with a flux ~2.2 × 10⁻⁹ erg cm−2 s−1) shows a deviating column density value.
Current usage metrics show cumulative count of Article Views (full-text article views including HTML views, PDF and ePub downloads, according to the available data) and Abstracts Views on Vision4Press platform.
Data correspond to usage on the plateform after 2015. The current usage metrics is available 48-96 hours after online publication and is updated daily on week days.
Initial download of the metrics may take a while.