Fig. 4.
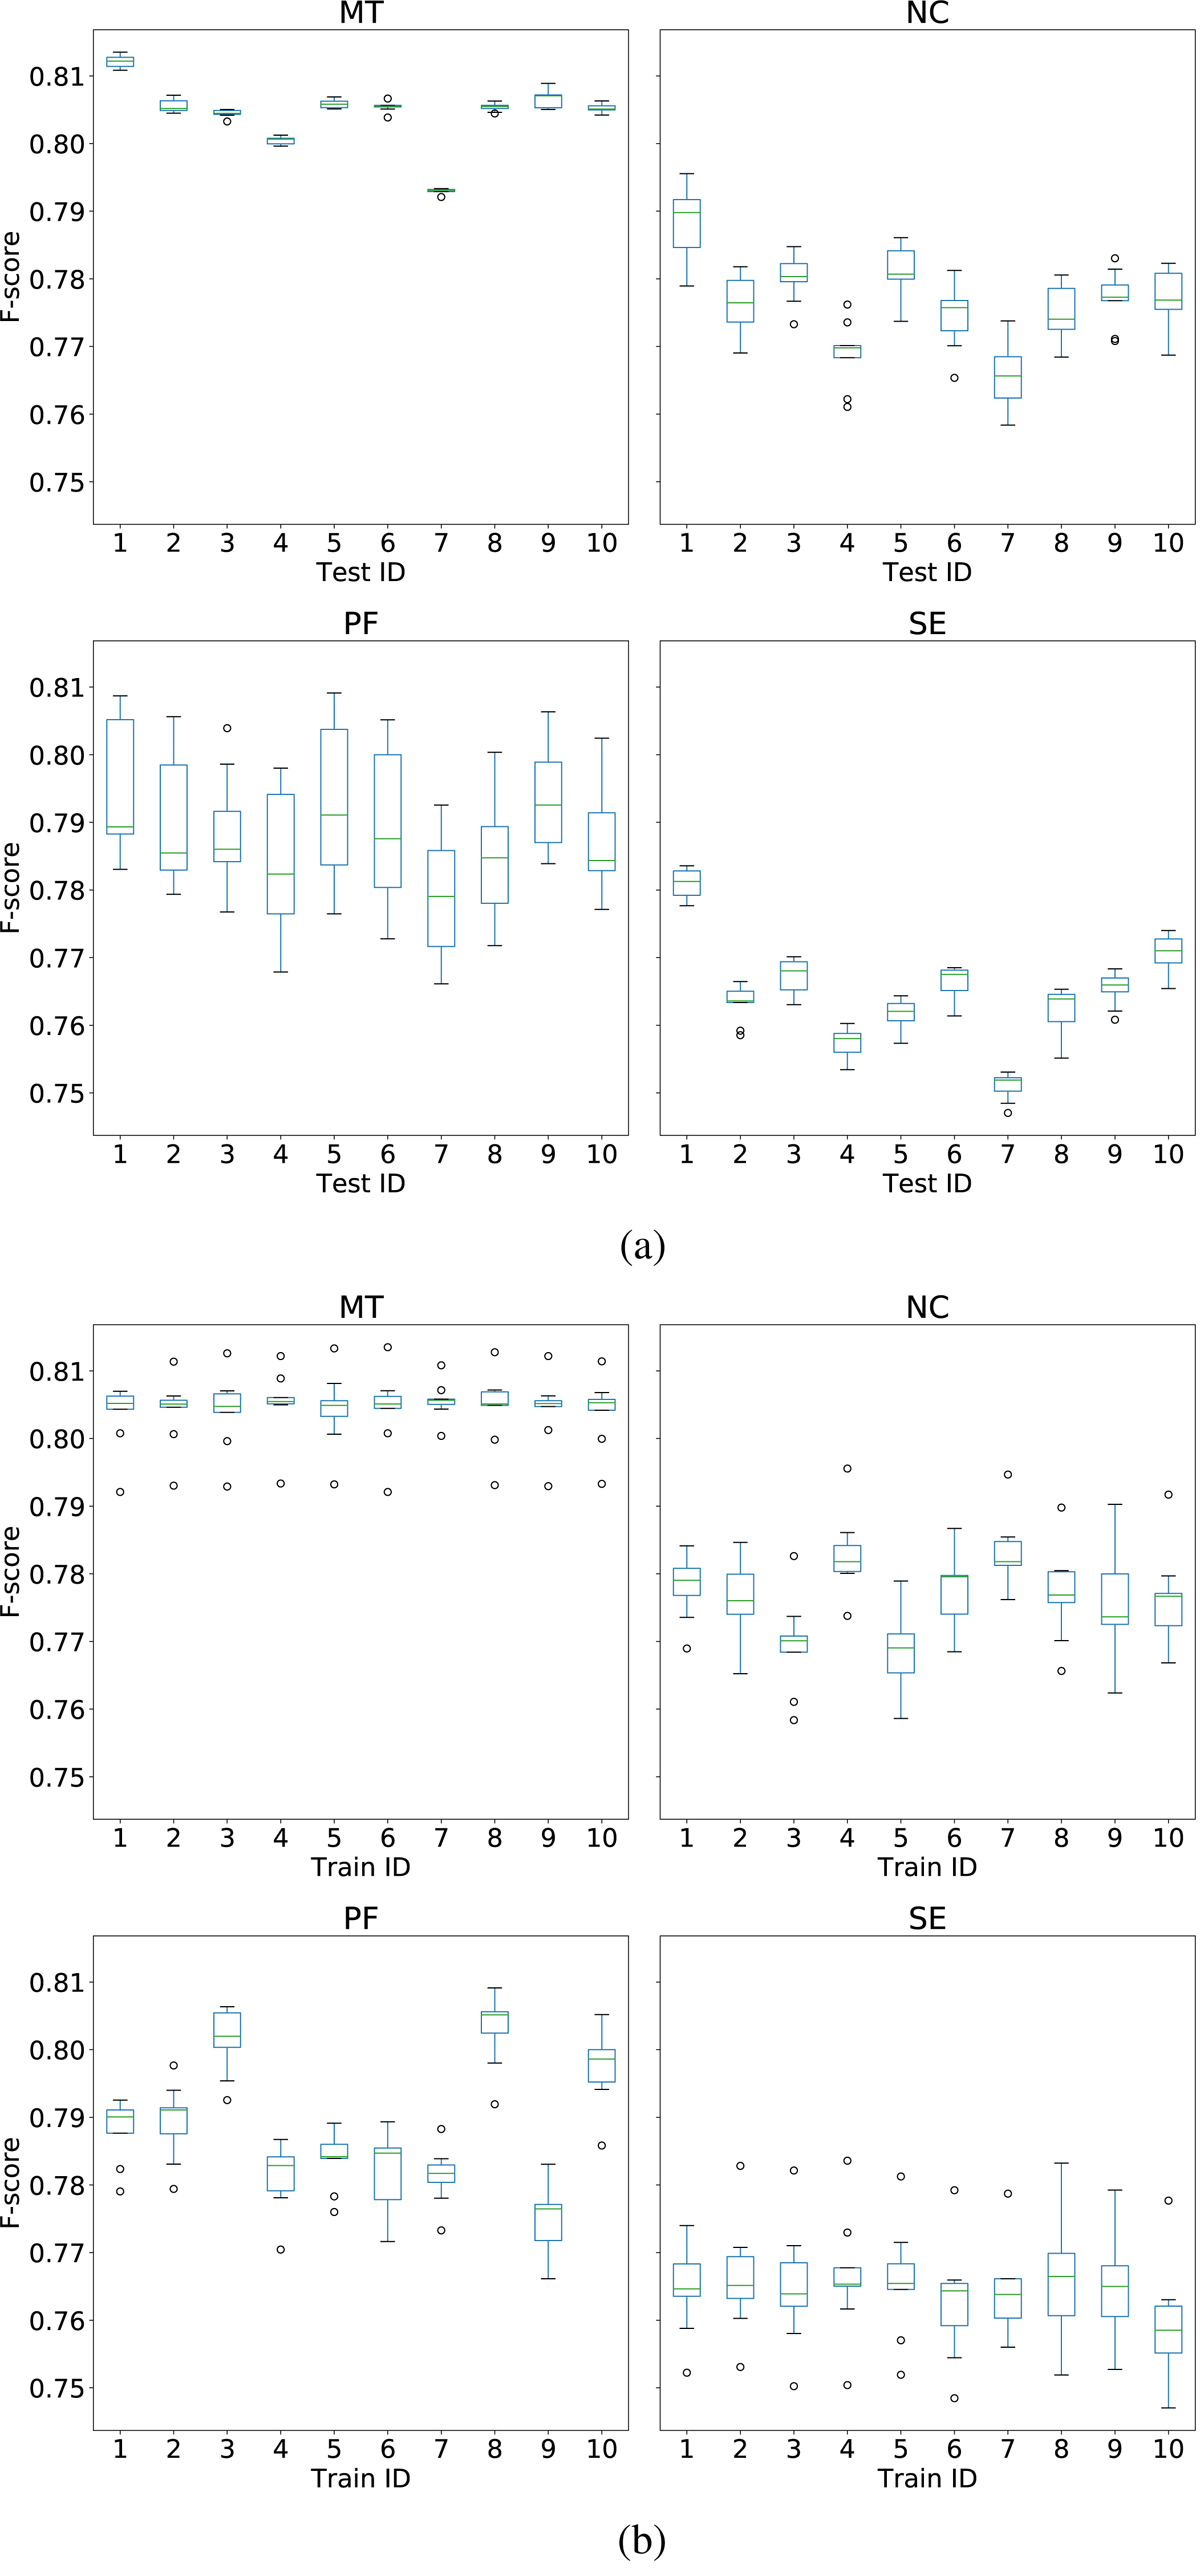
F-score test distributions. The parameters of each tool were optimised for F-score on each of the ten images, and evaluated on the remaining nine images. Boxes extend from first (Q1) to third (Q3) quartiles of the results, with median values marked; whiskers extend to the furthest F-score less than 1.5 * (Q3 − Q1) from each end of the box. (a) F-scores grouped by image evaluated. (b) F-scores grouped by image used to optimise parameters.
Current usage metrics show cumulative count of Article Views (full-text article views including HTML views, PDF and ePub downloads, according to the available data) and Abstracts Views on Vision4Press platform.
Data correspond to usage on the plateform after 2015. The current usage metrics is available 48-96 hours after online publication and is updated daily on week days.
Initial download of the metrics may take a while.