Fig. 1.
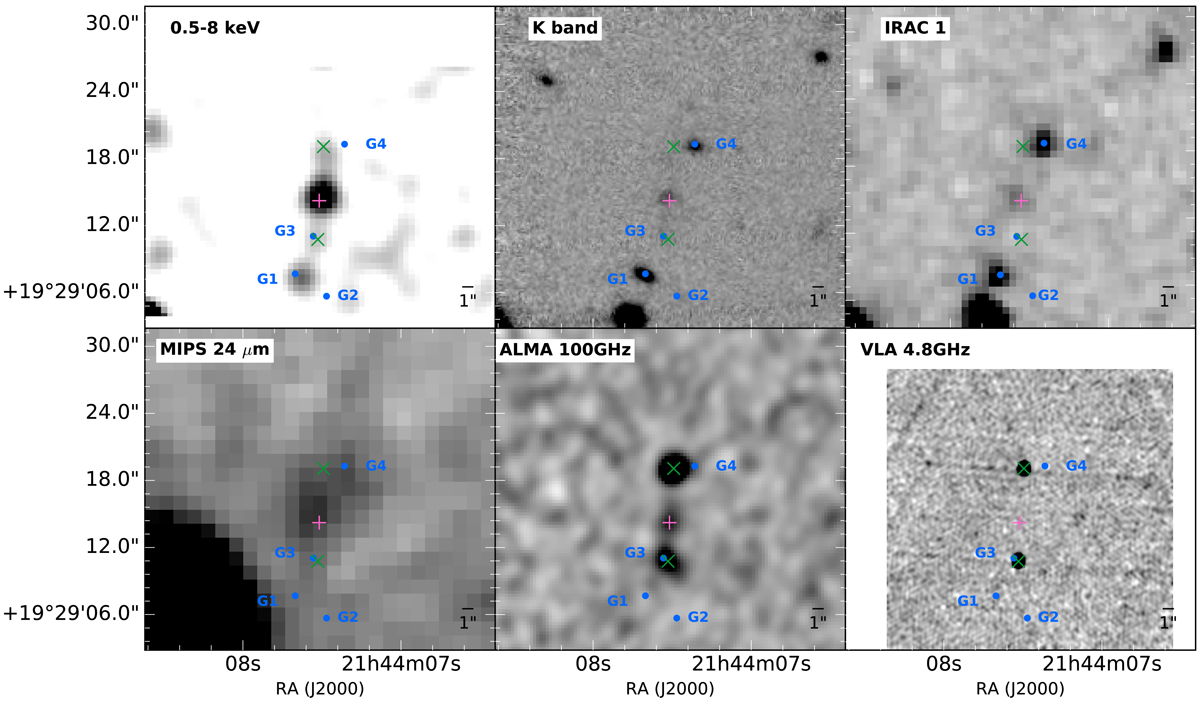
Six views around 4C 19.71 using previously published data. Top left: smoothed 0.5−8 keV Chandra images (Smail et al. 2012); top center: K-band 2.0−2.45 μm (Armus et al. 1998); top right: IRAC 3.6 μm (Seymour et al. 2007); bottom left: MIPS 24 μm (De Breuck et al. 2010); bottom center: ALMA band 3 continuum of 94.6−98.4 GHz and 106.5−110.3 GHz (Falkendal et al. 2019); bottom right: VLA band C 4.8 GHz (Pentericci et al. 2000). The pink plus signs indicate the center of the host galaxy determined from the peak of the thermal dust emission in the ALMA band 3 continuum image. Green crosses indicate the positions of the hot spots of the two radio lobes. The filled blue circles show the location of four foreground galaxies around 4C 19.71. For details about coordinates and redshifts of the sources in the field, see Table A.1.
Current usage metrics show cumulative count of Article Views (full-text article views including HTML views, PDF and ePub downloads, according to the available data) and Abstracts Views on Vision4Press platform.
Data correspond to usage on the plateform after 2015. The current usage metrics is available 48-96 hours after online publication and is updated daily on week days.
Initial download of the metrics may take a while.