Fig. A.1.
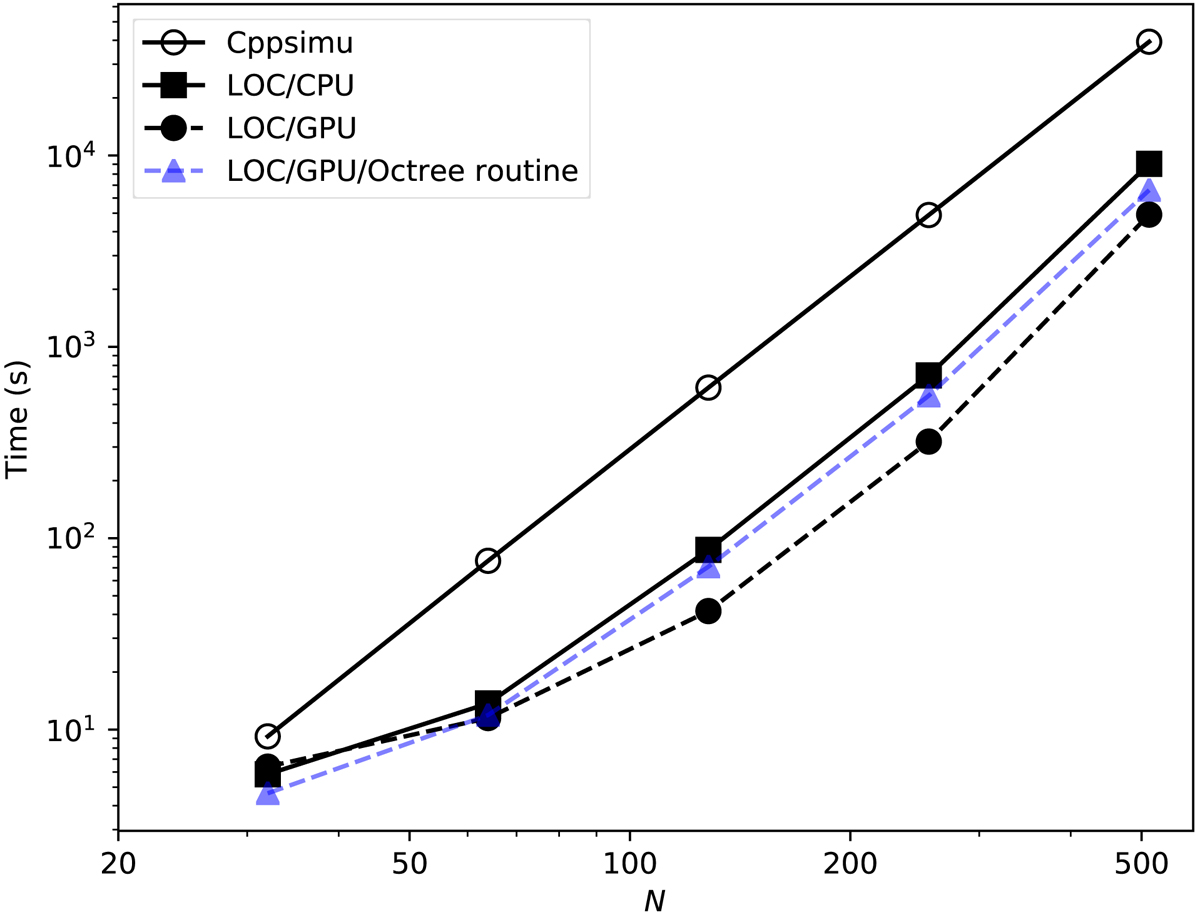
Comparison of Cppsimu (open circles) and LOC (filled black symbols) run times for CO line calculations, using a 3D model discretised onto a regular Cartesian grid. The x-axis gives the linear model size N, the models having N3 cells, and the y-axis shows the total run time, including the simulation of the radiation field and the solving of the equilibrium equations. The figure also shows LOC run times when the ray-tracing on the Cartesian grid is made with the more complex routines needed for octree grids.
Current usage metrics show cumulative count of Article Views (full-text article views including HTML views, PDF and ePub downloads, according to the available data) and Abstracts Views on Vision4Press platform.
Data correspond to usage on the plateform after 2015. The current usage metrics is available 48-96 hours after online publication and is updated daily on week days.
Initial download of the metrics may take a while.