Fig. 8.
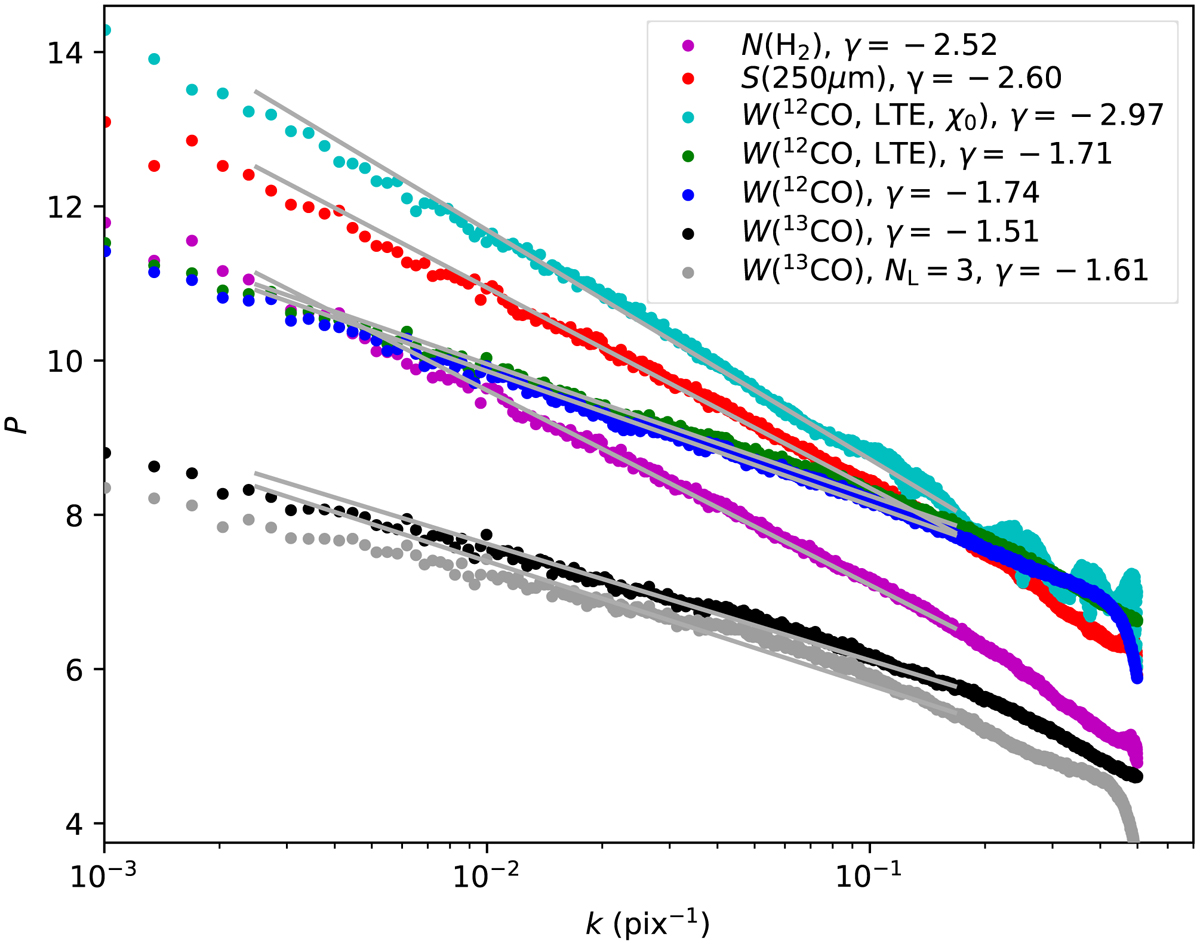
Power spectra from synthetic observations of the large-scale ISM simulation. The power P is calculated for the true column density, the 250 μm dust surface brightness, and for three versions of 12CO line-area maps. The 12CO emission corresponds either to a constant abundance of χ0 = 10−4 and LTE conditions or to the Eq. (4) abundances with LTE or non-LTE calculations. The grey lines correspond to least-squares fits and extend over the range of the fitted spatial frequencies.
Current usage metrics show cumulative count of Article Views (full-text article views including HTML views, PDF and ePub downloads, according to the available data) and Abstracts Views on Vision4Press platform.
Data correspond to usage on the plateform after 2015. The current usage metrics is available 48-96 hours after online publication and is updated daily on week days.
Initial download of the metrics may take a while.