Fig. 7.
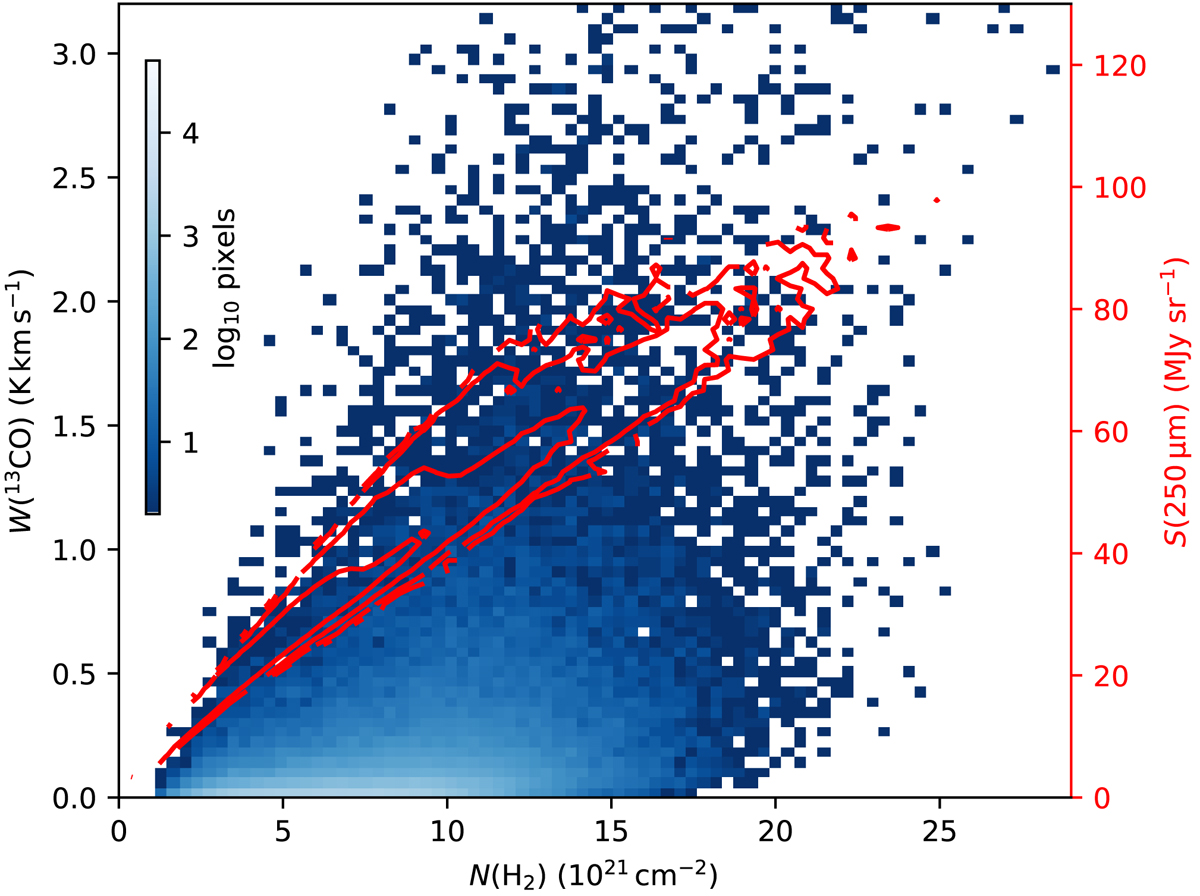
Dust and 13CO line emission as functions of column density of the large-scale ISM simulation. The blue 2D histogram shows the distribution of the 13CO line area vs. the true column density. The colour bar indicates the number of pixels in the original line emission maps per 2D histogram bin. The corresponding distribution of 250 μm surface brightness vs. column density (right-hand axis) is shown with red contours. The contour levels correspond to log10npix = 0.5, 1, 2, and 3 for the number image pixels npix per 2D histogram bin. The number of 2D bins is the same as for the 250 μm surface brightness histogram.
Current usage metrics show cumulative count of Article Views (full-text article views including HTML views, PDF and ePub downloads, according to the available data) and Abstracts Views on Vision4Press platform.
Data correspond to usage on the plateform after 2015. The current usage metrics is available 48-96 hours after online publication and is updated daily on week days.
Initial download of the metrics may take a while.