Fig. 4.
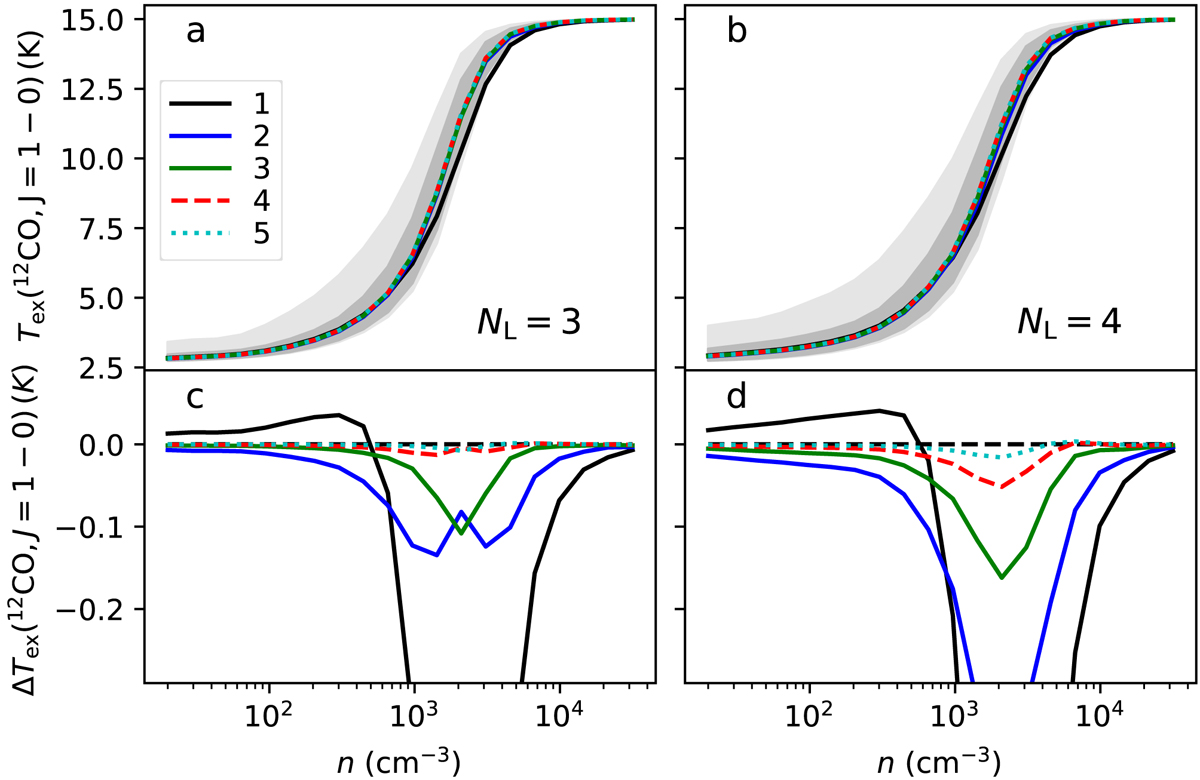
Average 12CO(1–0) excitation temperatures in different density bins in the large-scale ISM simulation. The colours correspond to the situation after a given number of iterations, as indicated in the legend. The left frames show results for a model with a of 2563 cell root grid and NL = 3, and the right frame shows this for the same model with NL = 4. For a given density, the grey bands indicate the 1%-99% and 10%–90% intervals of the Tex values. The lower plots show the differences in the Tex values between iterations 1-5 and the seventh iteration (an approximation of the fully converged solution). The horizontal dashed black line corresponds to the ΔTex = 0 K level.
Current usage metrics show cumulative count of Article Views (full-text article views including HTML views, PDF and ePub downloads, according to the available data) and Abstracts Views on Vision4Press platform.
Data correspond to usage on the plateform after 2015. The current usage metrics is available 48-96 hours after online publication and is updated daily on week days.
Initial download of the metrics may take a while.