Fig. 3.
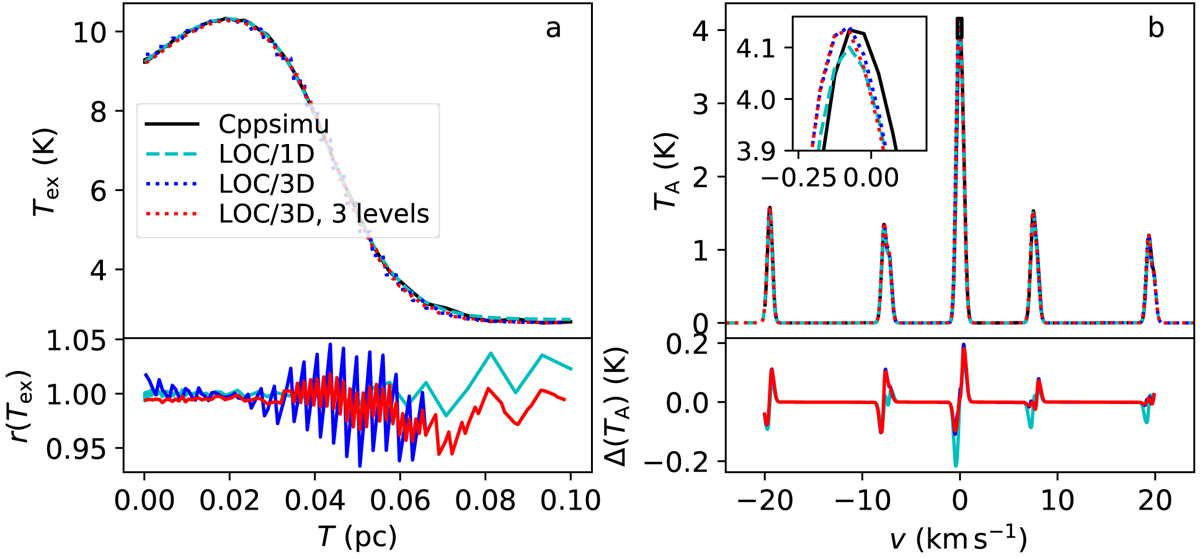
Comparison of NH3(1, 1) excitation temperatures and spectra for a spherically symmetric cloud. Frame a shows the radial Tex profiles computed with 1D versions of the Cppsimu and LOC programs and with the 3D version of LOC. The LOC runs use either a Cartesian grid with 643 cells or the same with two additional levels of refinement. Frame b compares the spectra observed towards the centre of the model. A zoom into the peak of the main component is shown in the inset. The lower plots show the ratio of Tex values (frame a) and the difference between the LOC and Cppsimu TA values (frame b), with the colours listed in frame a.
Current usage metrics show cumulative count of Article Views (full-text article views including HTML views, PDF and ePub downloads, according to the available data) and Abstracts Views on Vision4Press platform.
Data correspond to usage on the plateform after 2015. The current usage metrics is available 48-96 hours after online publication and is updated daily on week days.
Initial download of the metrics may take a while.