Fig. 2.
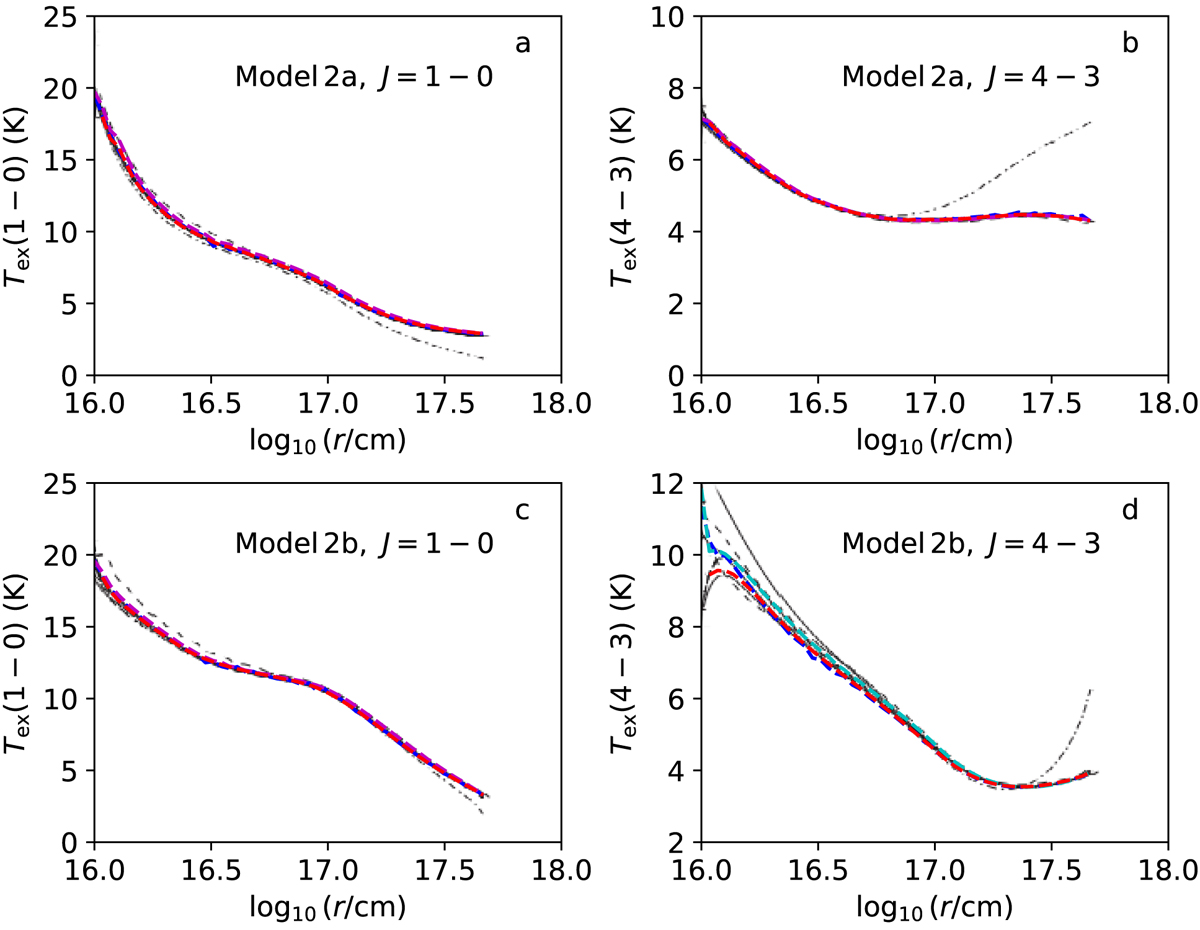
Comparison of 1D LOC results for cloud models presented in van Zadelhoff et al. (2002). The plots show the radial excitation temperature profiles of the HCO+J = 1 − 0 and J = 4 − 3 transitions for Model 2a and the optically thicker Model 2b. The LOC results are plotted with hashed red lines, the results of the Monte Carlo code Cppsimu are shown in blue and the other results (van Zadelhoff et al. 2002) in black (with different line types). In frame d, the cyan line shows LOC results for an alternative interpretation of the problem set-up.
Current usage metrics show cumulative count of Article Views (full-text article views including HTML views, PDF and ePub downloads, according to the available data) and Abstracts Views on Vision4Press platform.
Data correspond to usage on the plateform after 2015. The current usage metrics is available 48-96 hours after online publication and is updated daily on week days.
Initial download of the metrics may take a while.