Fig. B.1.
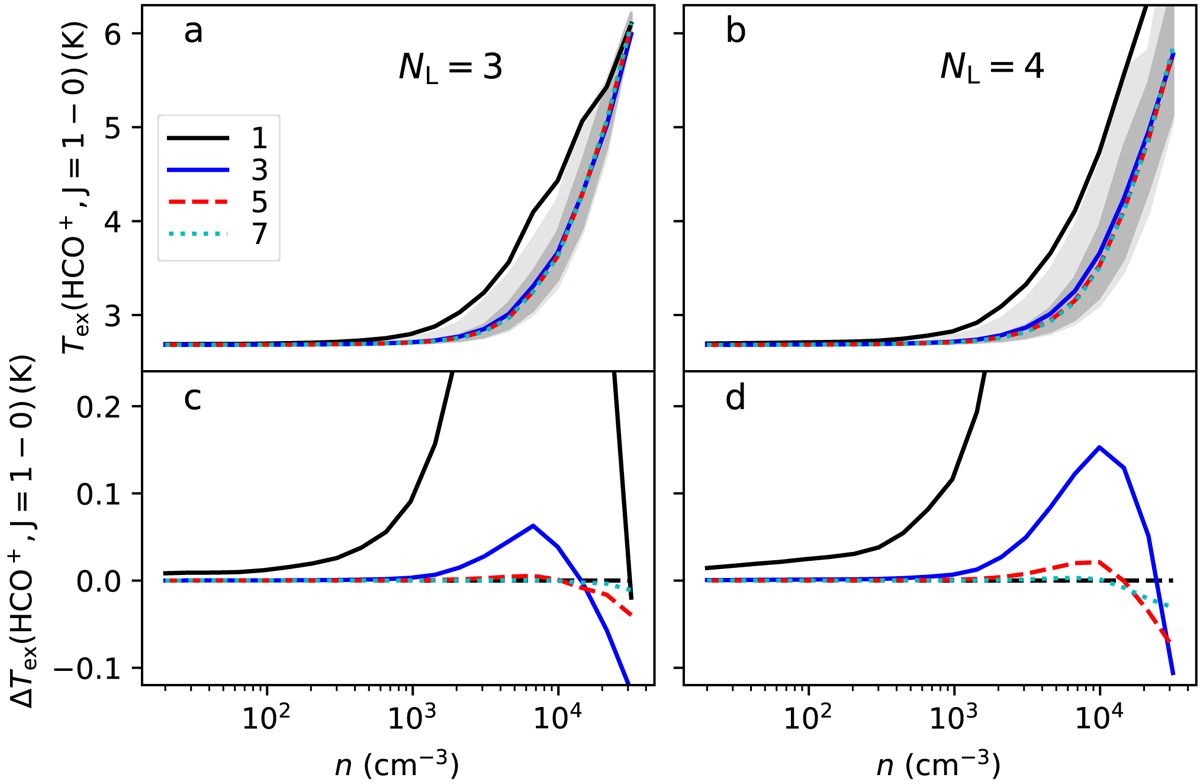
Average HCO+(1–0) excitation temperature as a function of density in the large-scale ISM simulation (cf. Fig. 4). The left and right frames show the results for different spatial discretisations (NL = 3, 4). The grey bands correspond to the 1%–99% and 10%–90% Tex intervals. The legend shows the colours that correspond to the different number of iterations. The lower frames show the Tex errors over iterations 1–7, estimated relative to the final values after 12 iterations. The horizontal dashed black line shows the ΔTex = 0 K level.
Current usage metrics show cumulative count of Article Views (full-text article views including HTML views, PDF and ePub downloads, according to the available data) and Abstracts Views on Vision4Press platform.
Data correspond to usage on the plateform after 2015. The current usage metrics is available 48-96 hours after online publication and is updated daily on week days.
Initial download of the metrics may take a while.