Fig. A.2.
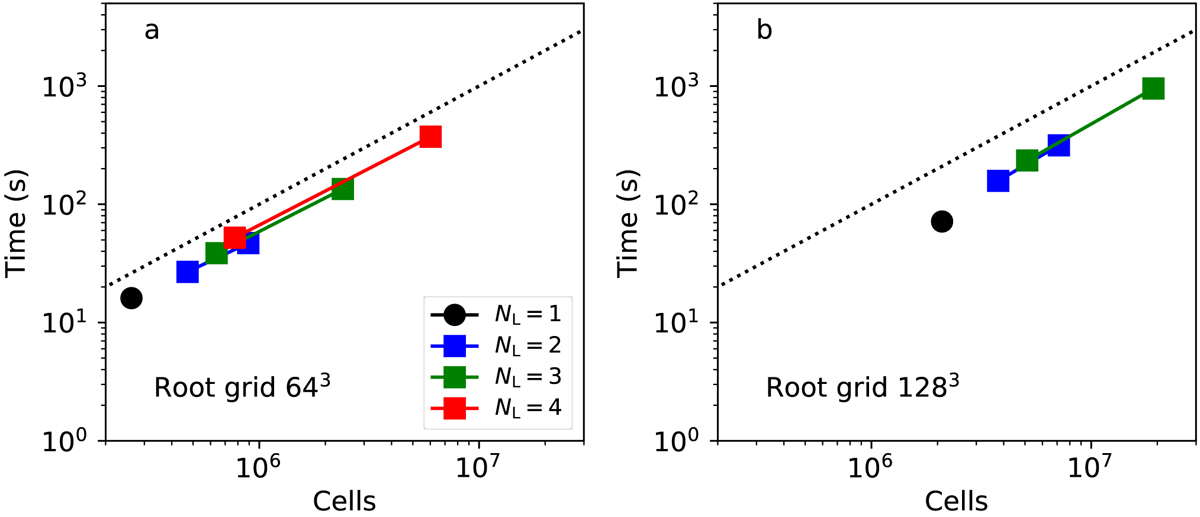
Comparison of LOC run times on a GPU for different octree grids. The octree hierarchies have NL = 1 − 4 levels and a root grid of 643 (frame a) or 1283 (frame b) cells. The solid lines connect two cases where either 10% or 30% of the cells of the previous level are refined. The dotted lines indicate the slope of one-to-one scaling between the run time and the number of cells.
Current usage metrics show cumulative count of Article Views (full-text article views including HTML views, PDF and ePub downloads, according to the available data) and Abstracts Views on Vision4Press platform.
Data correspond to usage on the plateform after 2015. The current usage metrics is available 48-96 hours after online publication and is updated daily on week days.
Initial download of the metrics may take a while.