Fig. 9.
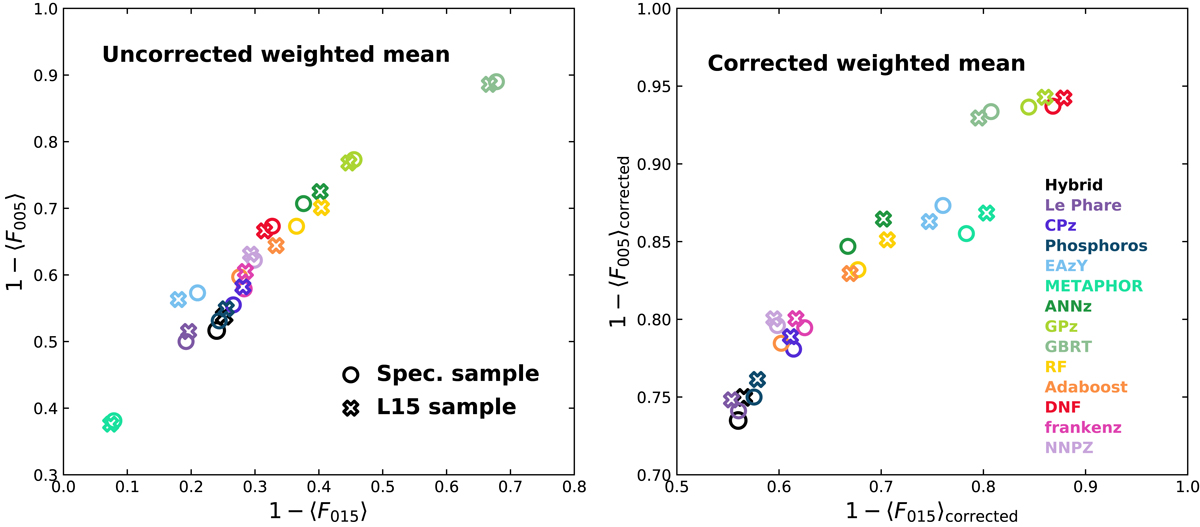
PDZs metrics summarized by averaging the F005 and F015 values on all the bins with different weighting schemes. The axes are 1 − ⟨F005⟩ and 1 − ⟨F015⟩ to mimic the usual σ − η plots in Fig. 4. Left: results per bin weighted by the fraction of sources in the bin compared to the total number of sources kept by each methods (see Eq. (6)). Right: results of all the methods when correcting the ⟨F005⟩ and ⟨F015⟩ of each bin by the square root of the ratio of good sources in the bins to the number of sources that truly belong to the bin (see Eq. (7)). In each plot we include the results for the hybrid method (in black, see Sect. 5.4) for the weighted spectroscopic sample on the L15 sample.
Current usage metrics show cumulative count of Article Views (full-text article views including HTML views, PDF and ePub downloads, according to the available data) and Abstracts Views on Vision4Press platform.
Data correspond to usage on the plateform after 2015. The current usage metrics is available 48-96 hours after online publication and is updated daily on week days.
Initial download of the metrics may take a while.