Fig. 5.
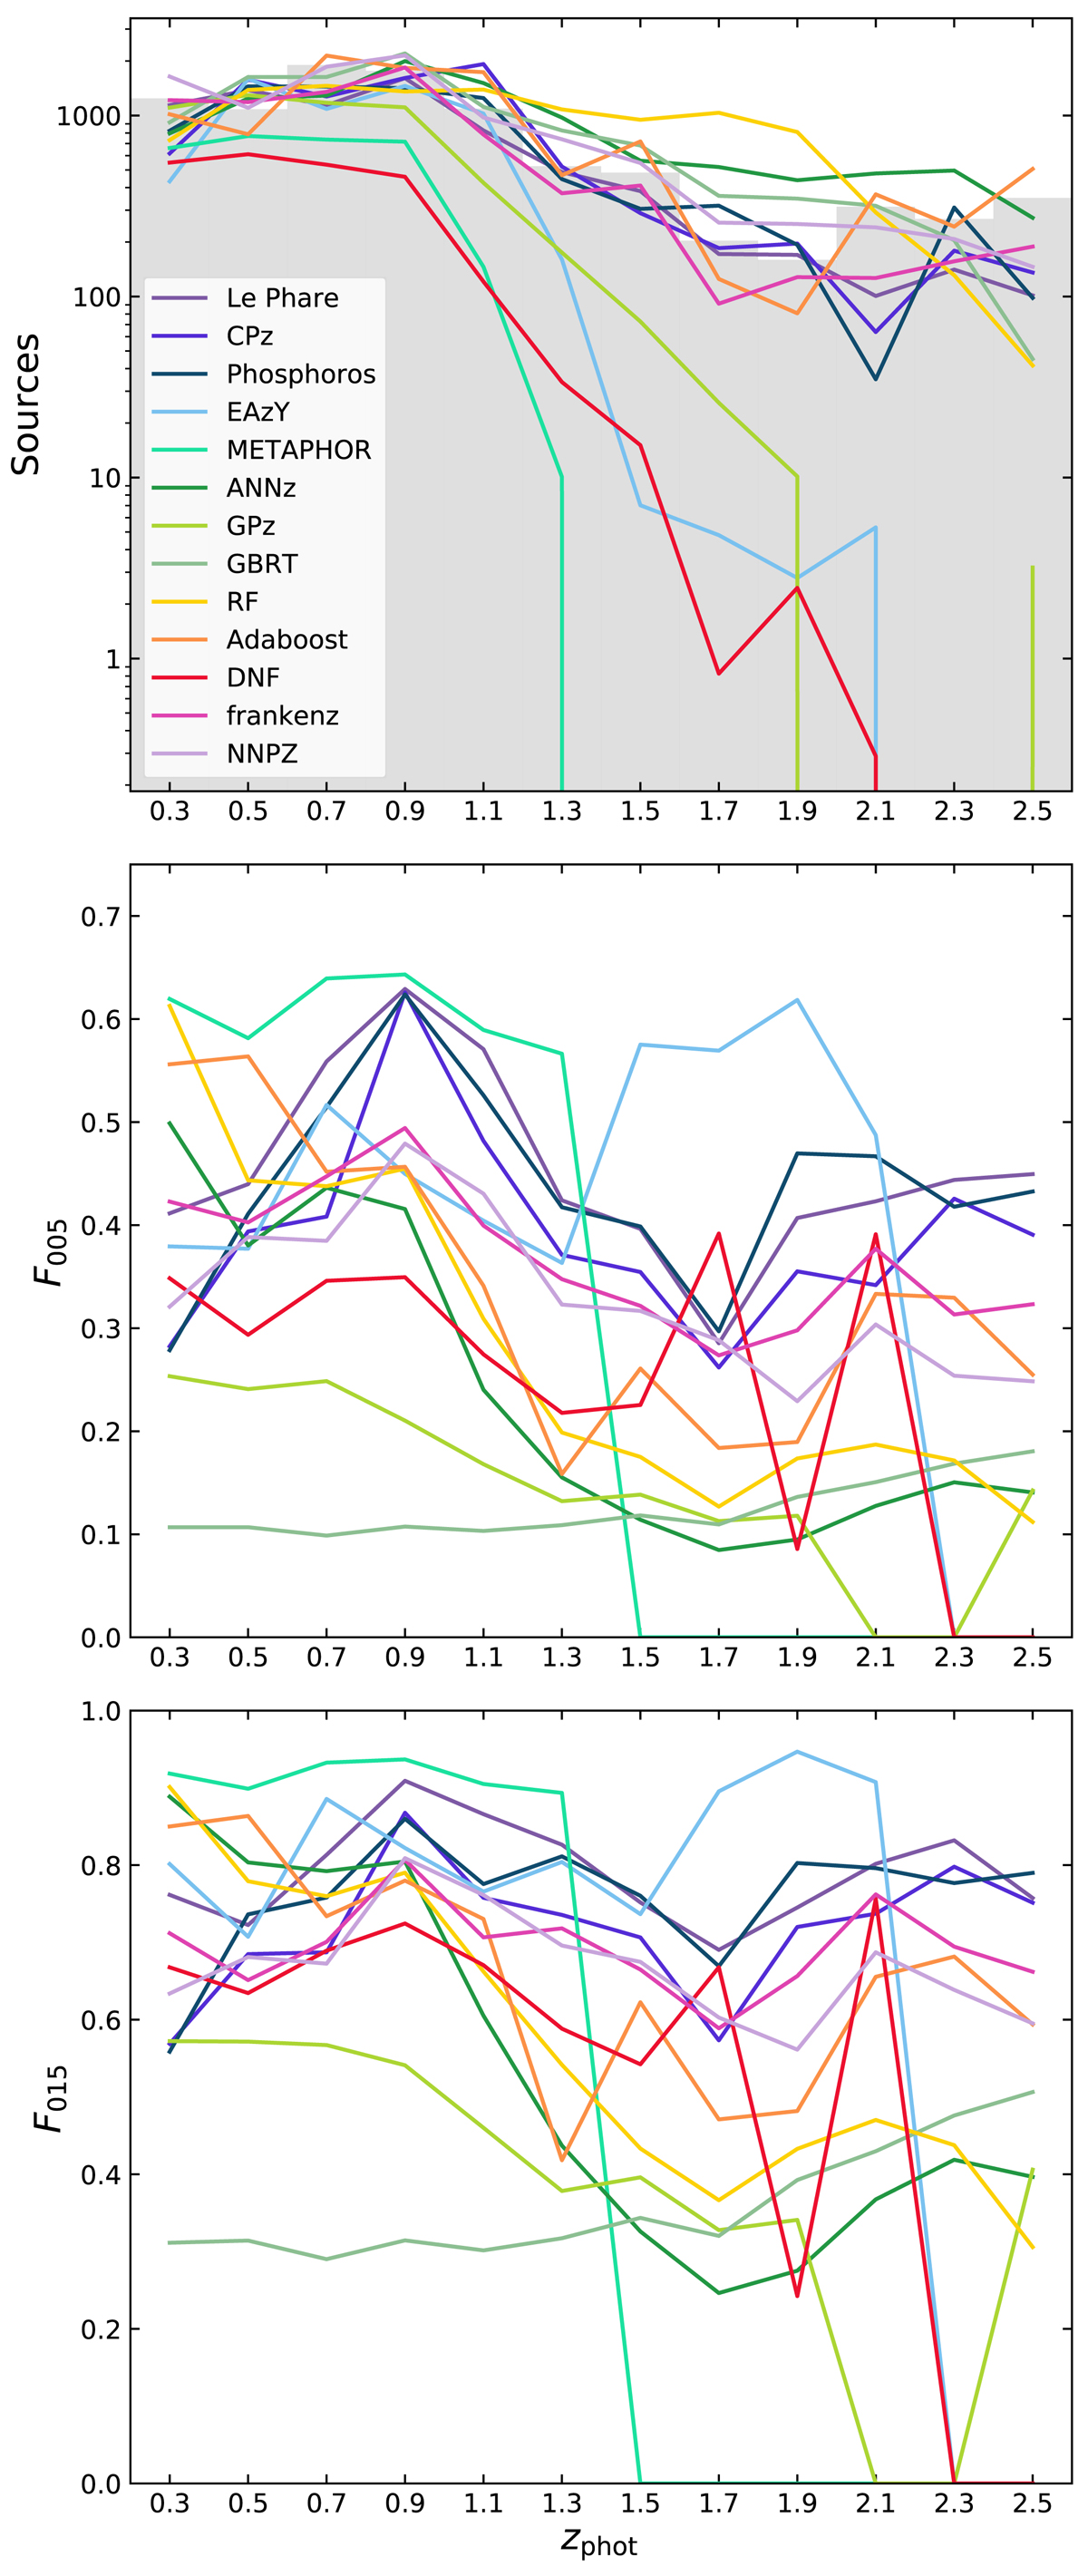
PDZ metrics for the color-space weighted spectroscopic sample. Top: number of sources in the bin. The histogram of the distribution for the sources in the bins according to their spec-zs is shown in gray. Middle: fraction of the stacked-and-shifted PDZs in 0.05(1 + z) (F005). Bottom: fraction of the stacked-and-shifted PDZs in 0.15(1 + z) (F015) for all the tested methods. Fractions close to 1 in a bin indicate good results.
Current usage metrics show cumulative count of Article Views (full-text article views including HTML views, PDF and ePub downloads, according to the available data) and Abstracts Views on Vision4Press platform.
Data correspond to usage on the plateform after 2015. The current usage metrics is available 48-96 hours after online publication and is updated daily on week days.
Initial download of the metrics may take a while.