Fig. 4.
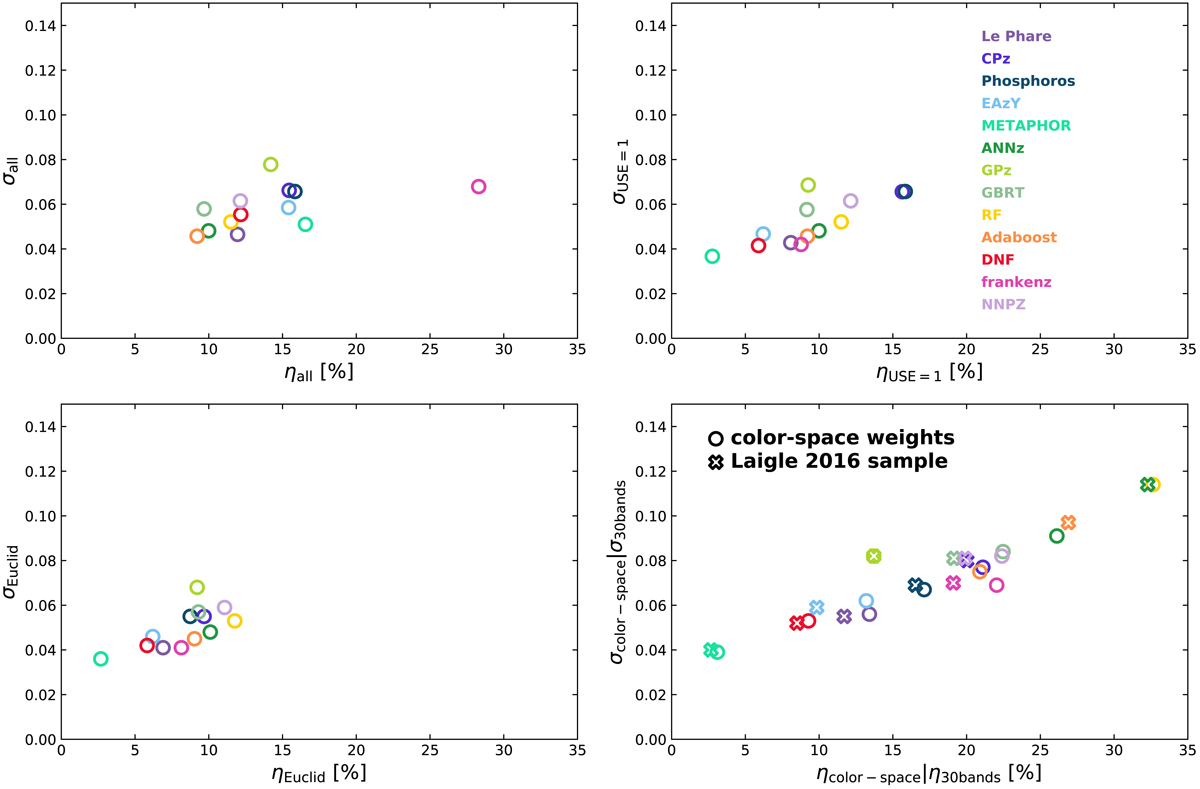
Point estimates metrics results comparison for all the methods. Circles represent the spectroscopic sample and crosses are the L15 one. Top left: scatter (σ) versus outlier fraction (η) of all methods for the whole spectroscopic sample (12 463 sources). Top right: σUSE = 1 versus ηUSE = 1 for USE = 1 selected sources for each method (see Table B.1 for all the values). Bottom left: σEuclid versus ηEuclid for the Euclid selection (see Table B.2). Bottom right: σ30-bands versus η30-bands using the L15 photo-z as reference redshift plotted as crosses (see Table B.4 for all the values) and Euclid sample results weighted with the color-space weights to match the spectroscopic sample to the photometric one plotted as circles (see Table B.3). RF values are outside the limits of the plot for the L15 sample due to a large outlier fraction.
Current usage metrics show cumulative count of Article Views (full-text article views including HTML views, PDF and ePub downloads, according to the available data) and Abstracts Views on Vision4Press platform.
Data correspond to usage on the plateform after 2015. The current usage metrics is available 48-96 hours after online publication and is updated daily on week days.
Initial download of the metrics may take a while.