Fig. 3.
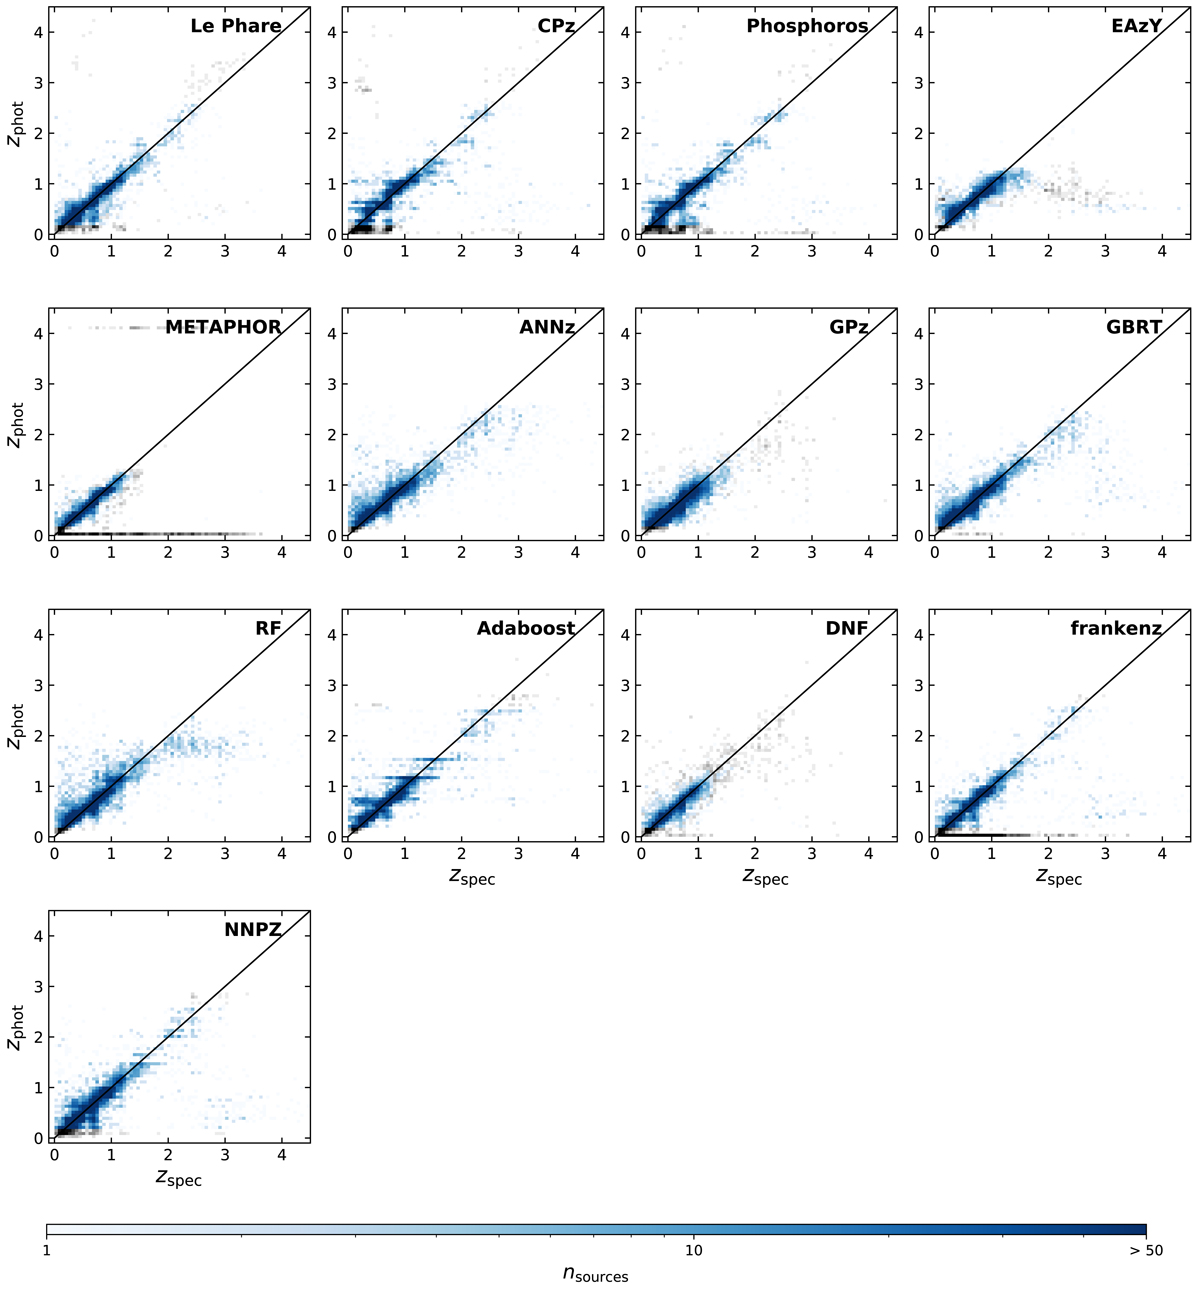
Density maps of photo-z versus spec-z for all the tested methods: blue are sources within the Euclid sample; gray are sources outside of the Euclid sample. The statistics on the photo-zs are presented in Fig. 4 and listed in Tables B.1 and B.2. Undefined or negative photo-zs have been set to 0, explaining the presence of horizontal lines in some panels (e.g., METAPHOR and frankenz).
Current usage metrics show cumulative count of Article Views (full-text article views including HTML views, PDF and ePub downloads, according to the available data) and Abstracts Views on Vision4Press platform.
Data correspond to usage on the plateform after 2015. The current usage metrics is available 48-96 hours after online publication and is updated daily on week days.
Initial download of the metrics may take a while.