Fig. C.1.
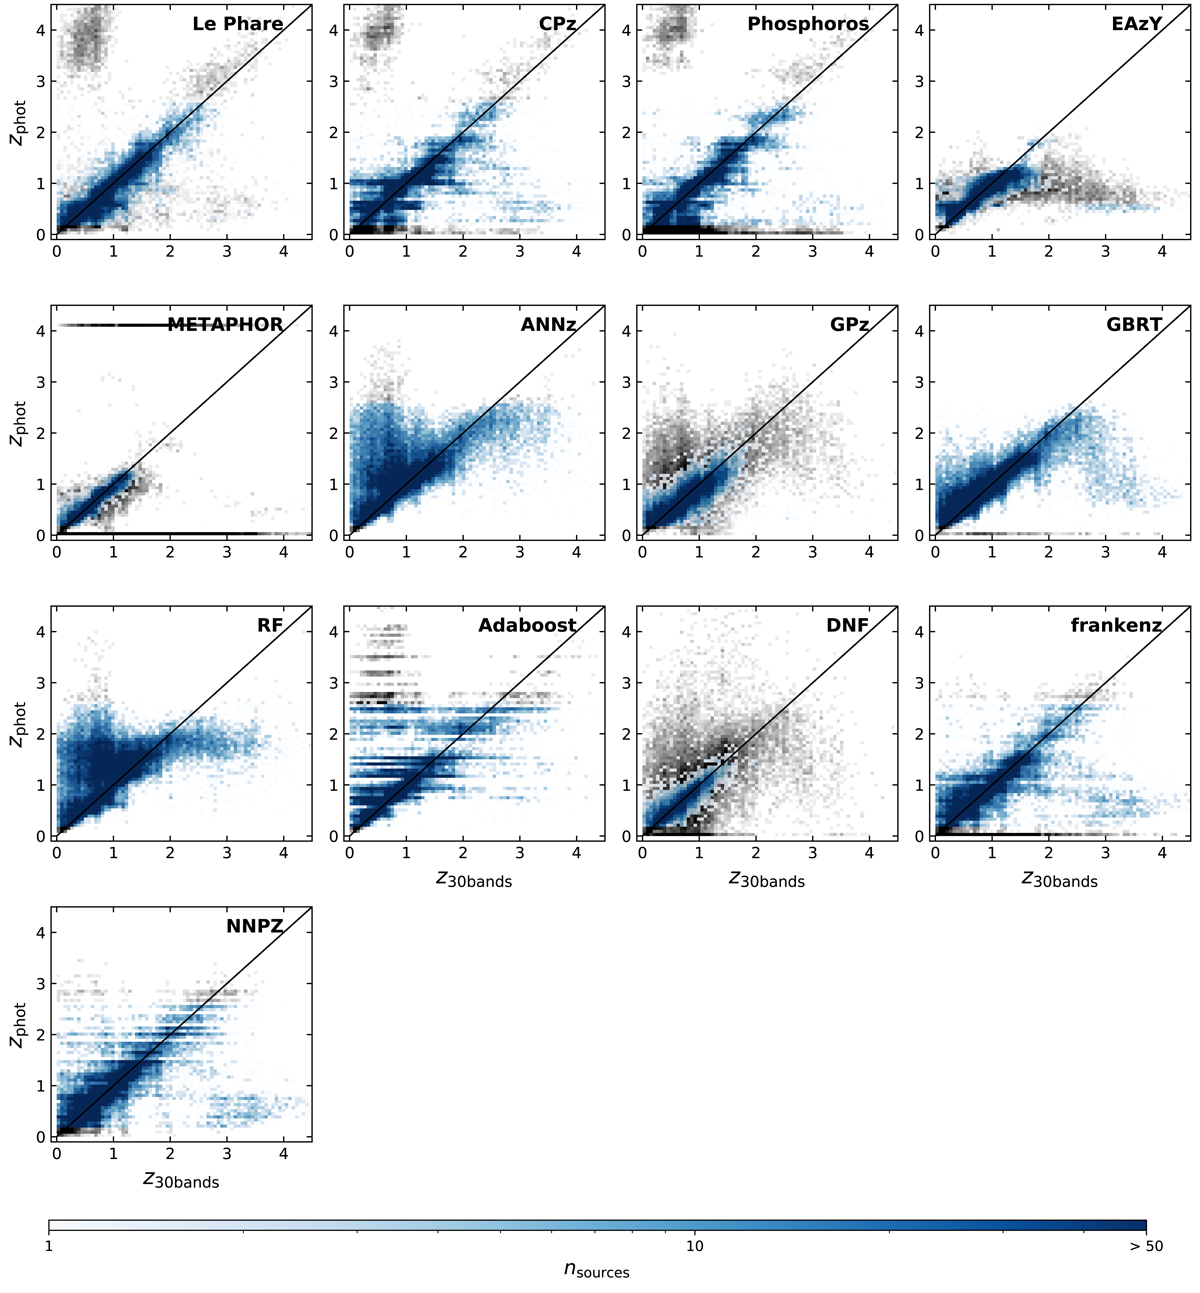
Photometric redshifts between 0.2 < z ≤ 2.6 measured with all the methods compared to the Laigle et al. (2016) 30-band photometric redshifts. The color code is the same here as in Fig. 3, meaning that the shades of blue represent the Euclid selection, and the shades of gray represent the rest of the L15 sample. As in Fig. 3, undefined or negative point estimate values have been set to 0 in the plots.
Current usage metrics show cumulative count of Article Views (full-text article views including HTML views, PDF and ePub downloads, according to the available data) and Abstracts Views on Vision4Press platform.
Data correspond to usage on the plateform after 2015. The current usage metrics is available 48-96 hours after online publication and is updated daily on week days.
Initial download of the metrics may take a while.