Fig. A.1.
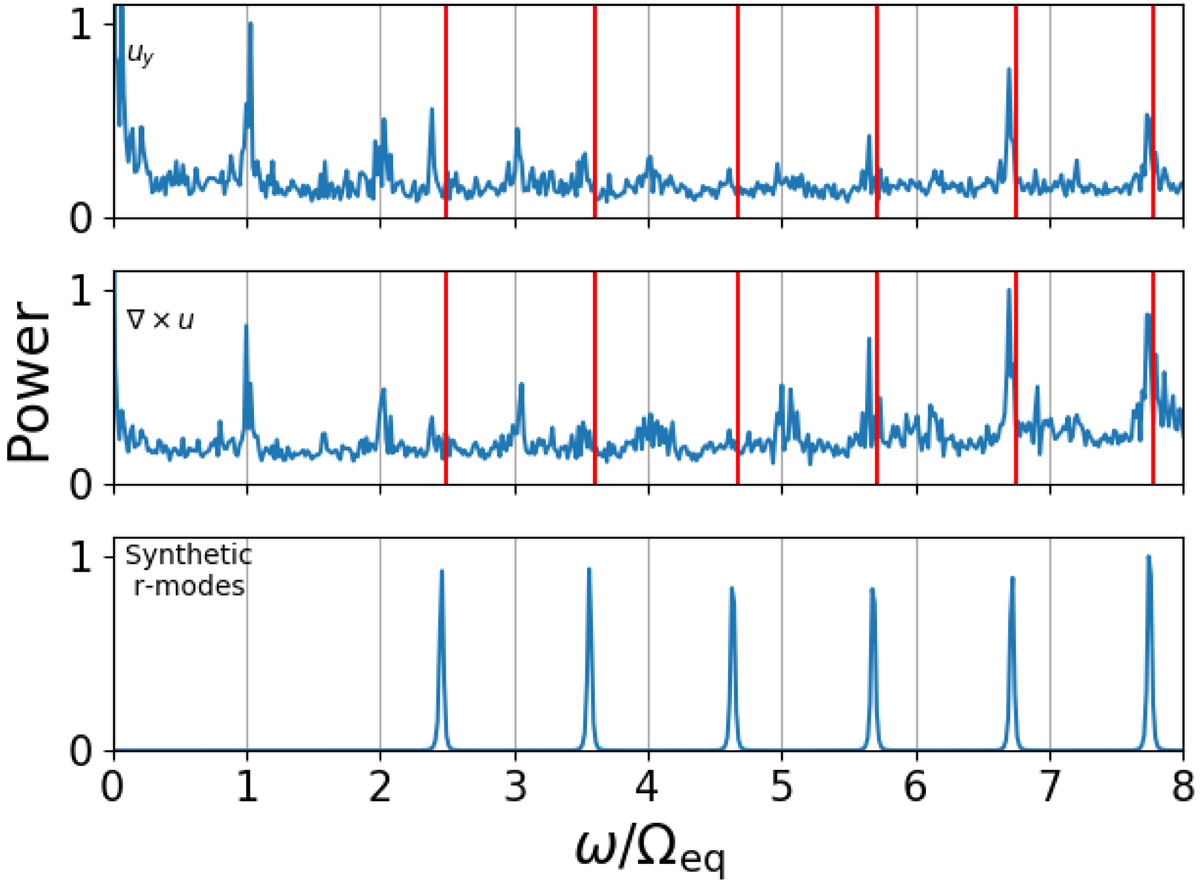
Power spectra of the GONG++ flow components and synthetic Rossby waves in the Stoneyhurst coordinate system at the equator. From the top to bottom panels are: the uy flows, radial vorticity, and uy component of synthetic Rossby waves (e.g., Hanson et al. 2020). Modes rotating at frequencies of multiples of Ωeq are indicated by the vertical gray lines. The vertical red lines show the rotational frequencies of the sectoral Rossby waves. We have considered only the m > 2 sectoral Rossby waves seen in the Sun.
Current usage metrics show cumulative count of Article Views (full-text article views including HTML views, PDF and ePub downloads, according to the available data) and Abstracts Views on Vision4Press platform.
Data correspond to usage on the plateform after 2015. The current usage metrics is available 48-96 hours after online publication and is updated daily on week days.
Initial download of the metrics may take a while.