Fig. 8.
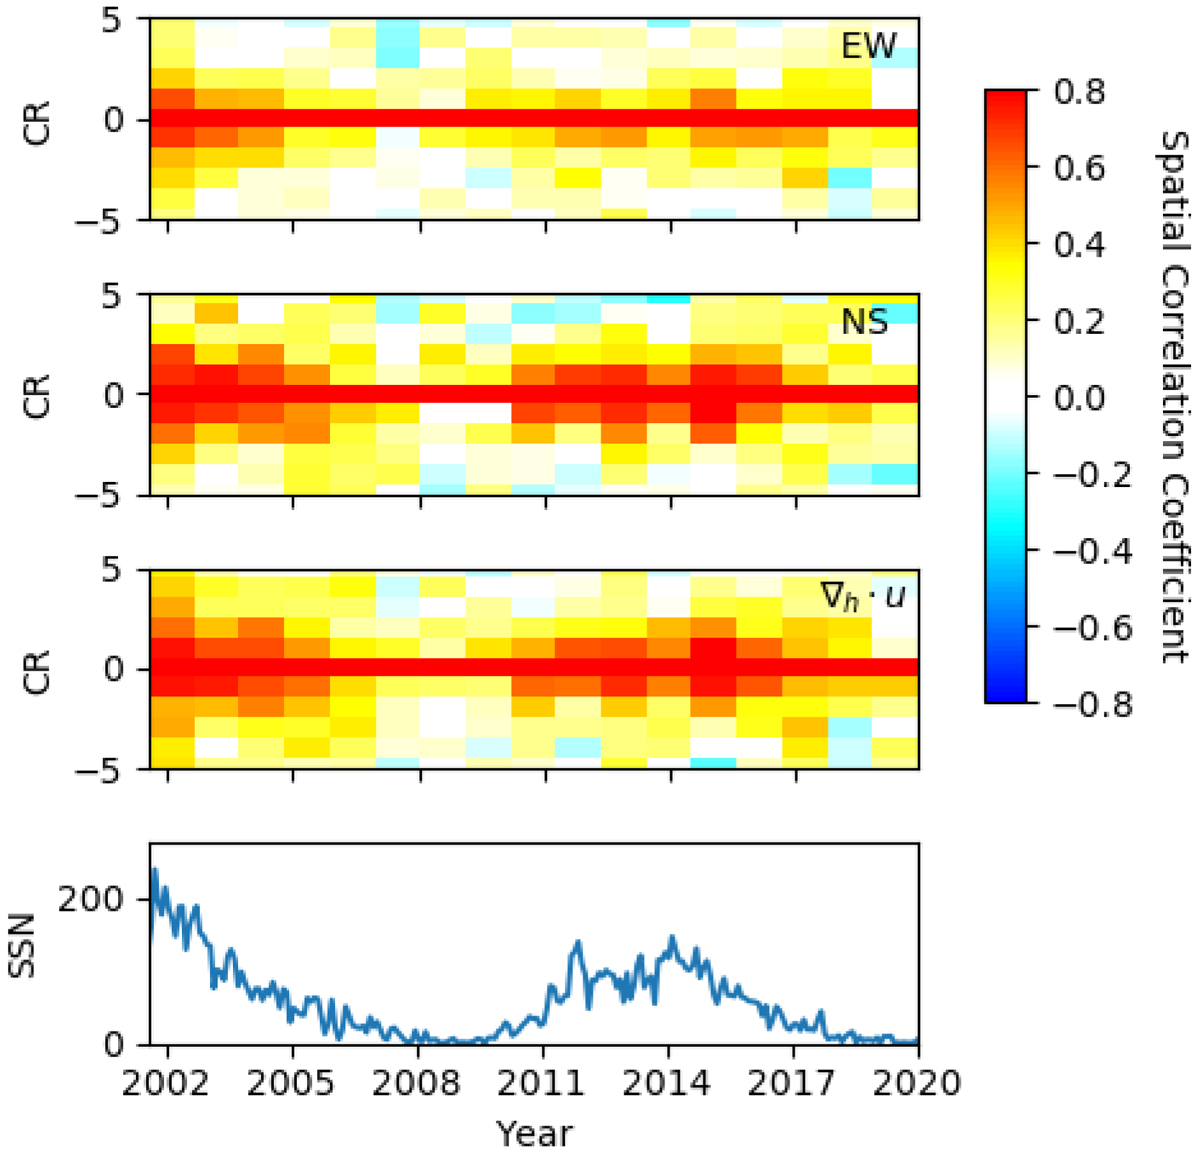
Spatial correlation coefficient between flow maps at CR = 0 and those at time lag CR, as a function of time and CR. The coefficients for the EW, NS, and divergence are shown in the top three panels, with the monthly sunspot number shown for reference in the bottom panel. The large-scale flows persist for a number of rotations during periods of high solar activity.
Current usage metrics show cumulative count of Article Views (full-text article views including HTML views, PDF and ePub downloads, according to the available data) and Abstracts Views on Vision4Press platform.
Data correspond to usage on the plateform after 2015. The current usage metrics is available 48-96 hours after online publication and is updated daily on week days.
Initial download of the metrics may take a while.