Fig. 6.
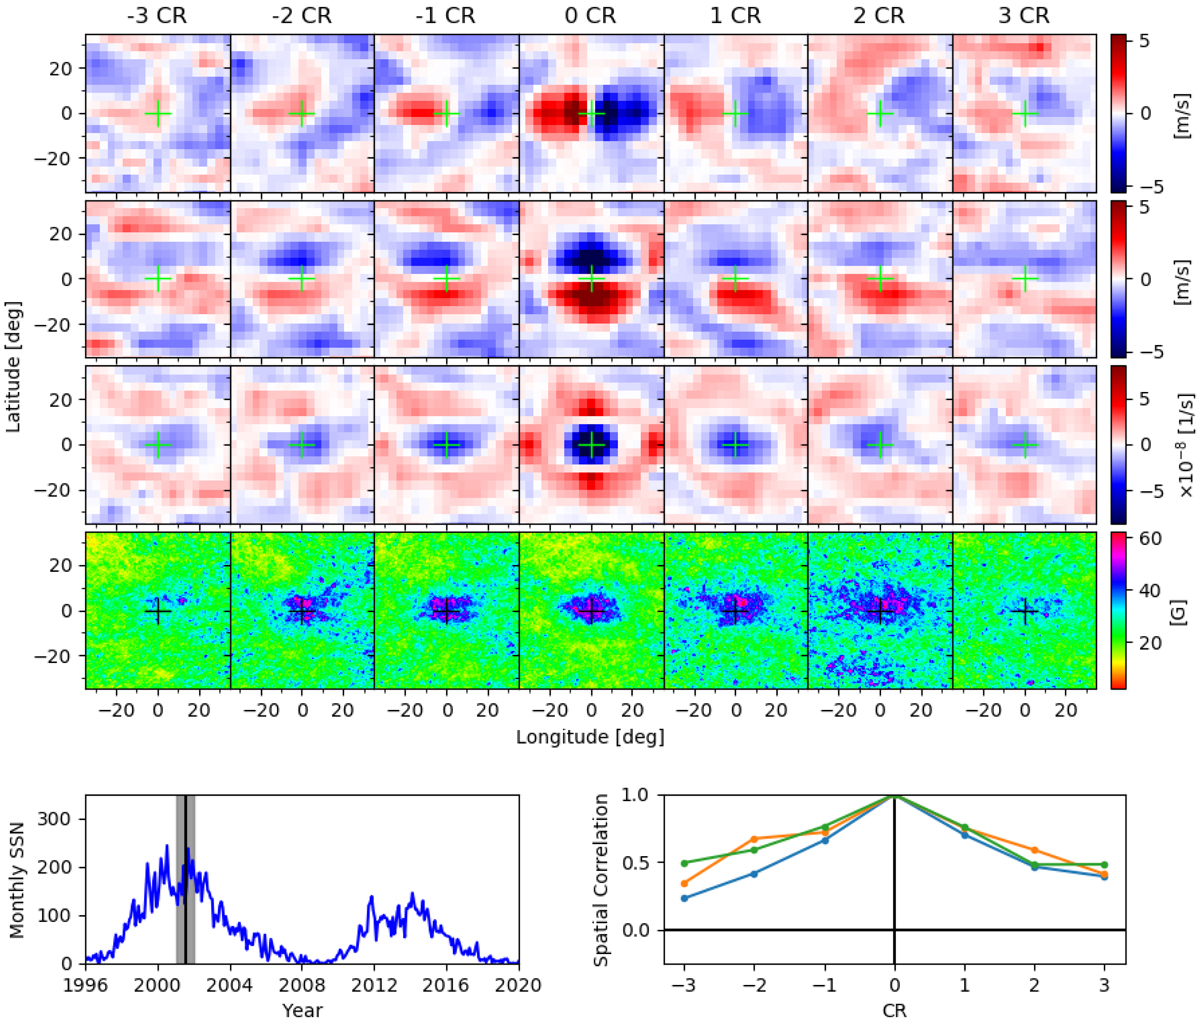
Top panels: average flows around convergent features during the solar maximum of cycle 23. Each of the first three rows is a different component of the flow, from top to bottom: EW flows, NS flows, and divergence maps. The fourth row is the average unsigned magnetic field. Each column is the mean map at an integer rotation before and after the initial identification (0 CR, middle column). Bottom-left panel: monthly sunspot number as a function of year (blue), with the center of the one-year observation window overplotted (vertical black line) and window size shown (shaded gray region). Bottom-right panel: spatial correlation coefficient between the CR = 0 flow maps and the flow maps at time lag CR (EW: blue; NS: orange; ∇h ⋅ u: green).
Current usage metrics show cumulative count of Article Views (full-text article views including HTML views, PDF and ePub downloads, according to the available data) and Abstracts Views on Vision4Press platform.
Data correspond to usage on the plateform after 2015. The current usage metrics is available 48-96 hours after online publication and is updated daily on week days.
Initial download of the metrics may take a while.