Free Access
Fig. 5.
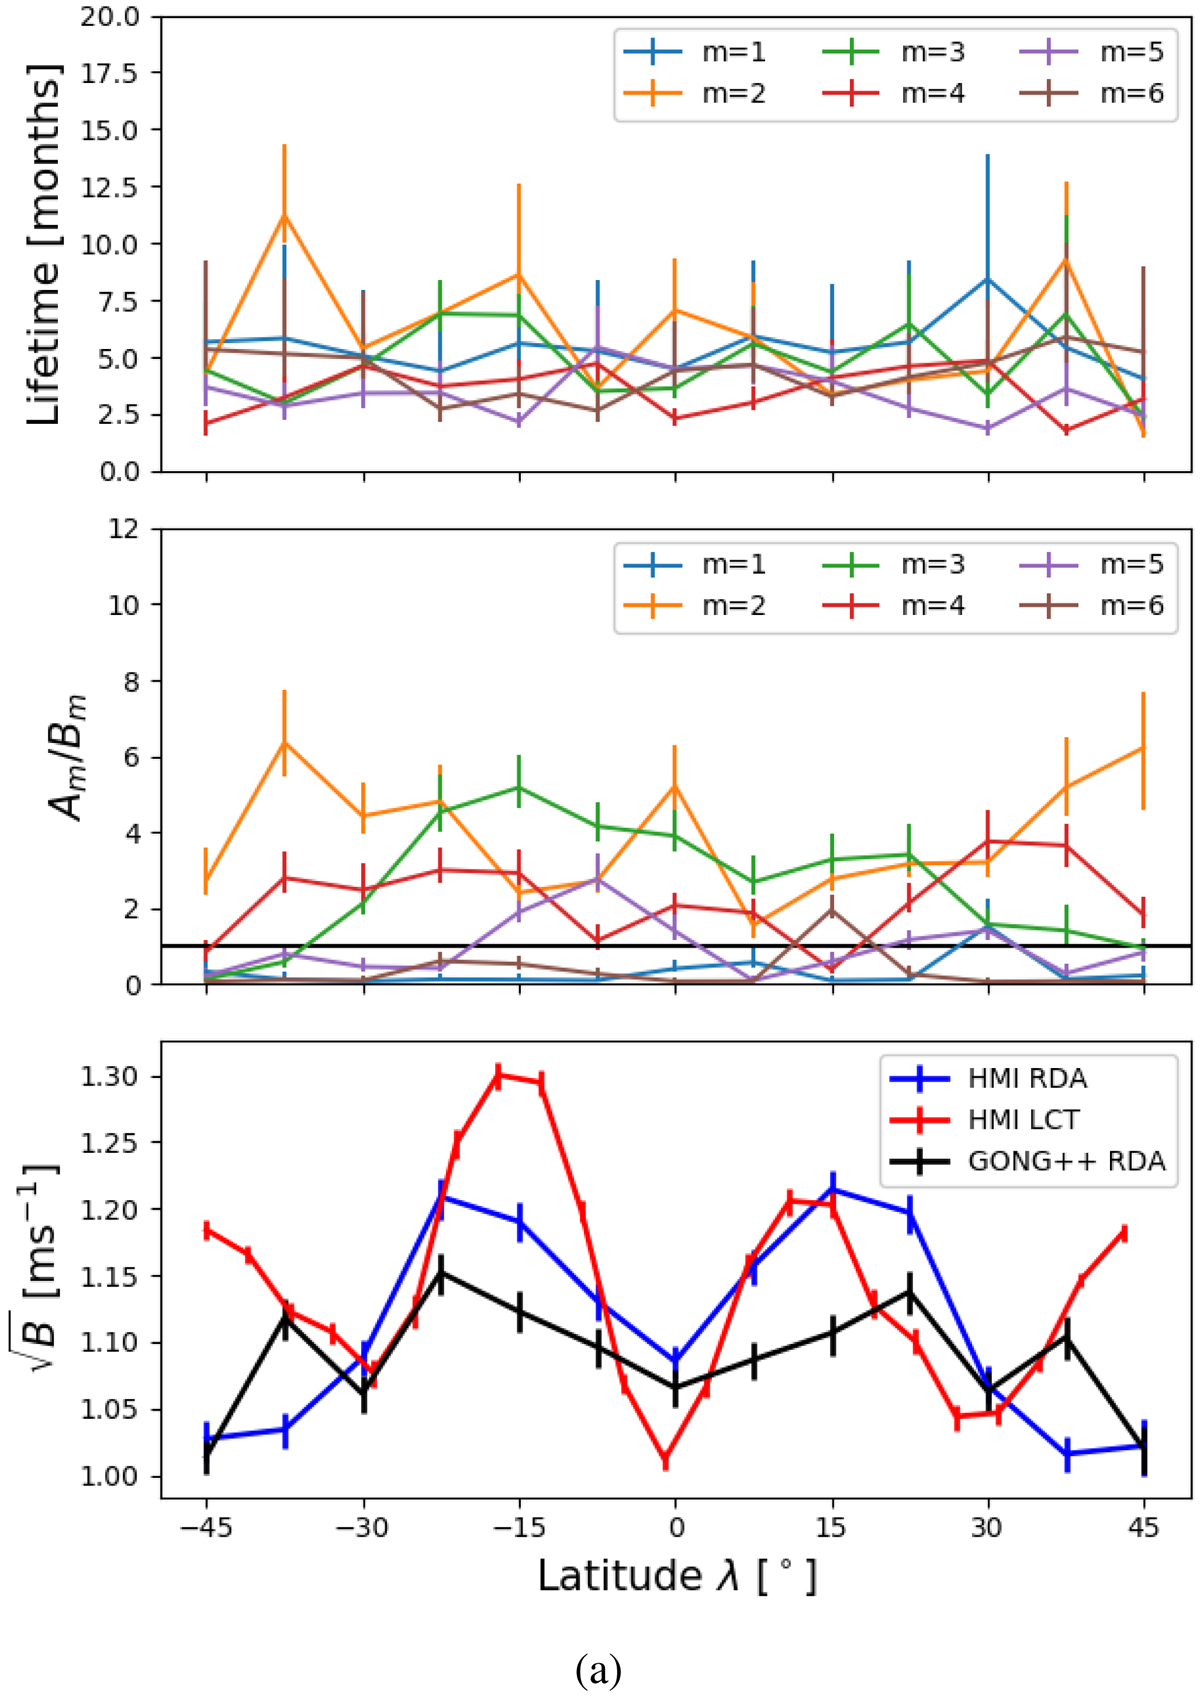
Top: lifetime of the modes seen in the HMI RDA EW power spectrum. Middle: signal-to-noise ratio (Am/Bm). Bottom: background power ![]() in the EW spectrum for all three data sets. Error bars are one sigma.
in the EW spectrum for all three data sets. Error bars are one sigma.
Current usage metrics show cumulative count of Article Views (full-text article views including HTML views, PDF and ePub downloads, according to the available data) and Abstracts Views on Vision4Press platform.
Data correspond to usage on the plateform after 2015. The current usage metrics is available 48-96 hours after online publication and is updated daily on week days.
Initial download of the metrics may take a while.