Free Access
Fig. 3.
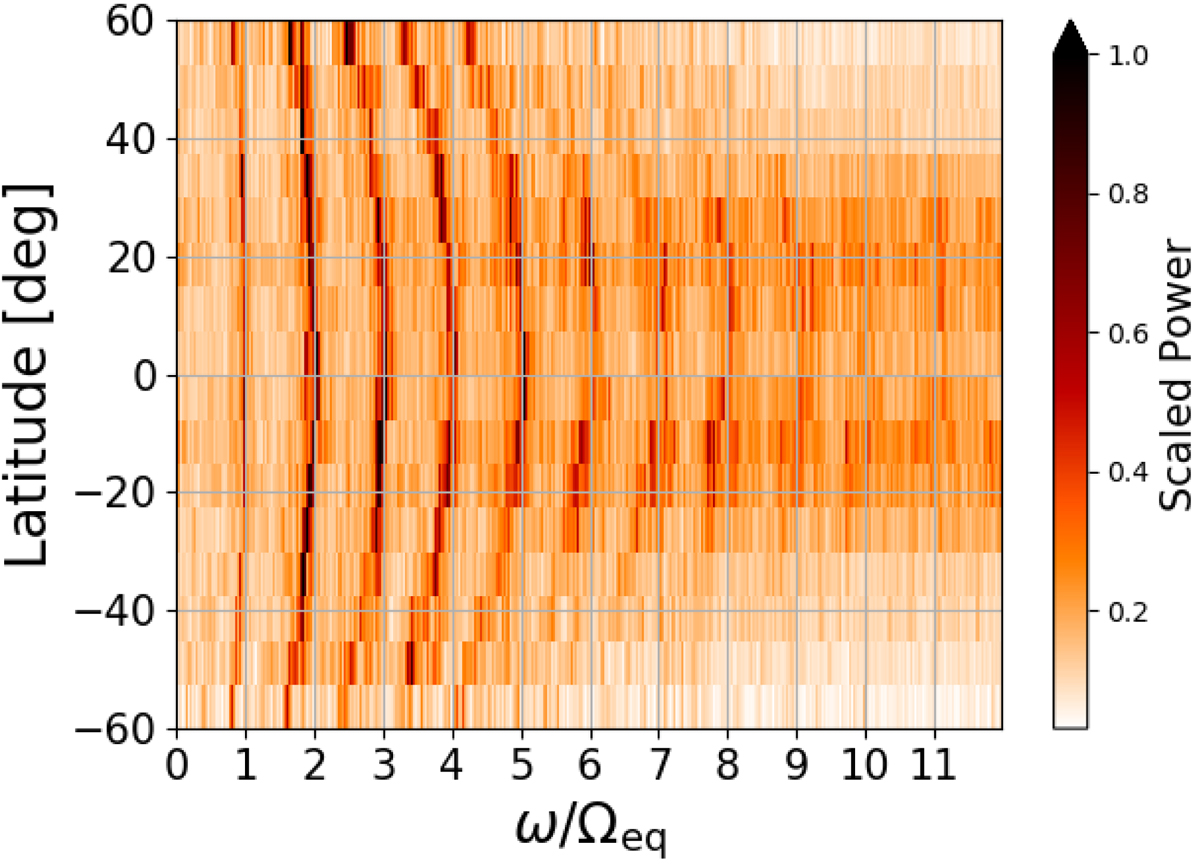
Plot of ![]() for HMI RDA as a function of latitude and frequency. The frequency is scaled by the rotational frequency at the equator Ωeq (2π/27.275 days). At the equator, power can be seen near integer values of ω/Ωeq, up to values of about nine. At latitudes above 30 deg, these higher-order modes are not visible.
for HMI RDA as a function of latitude and frequency. The frequency is scaled by the rotational frequency at the equator Ωeq (2π/27.275 days). At the equator, power can be seen near integer values of ω/Ωeq, up to values of about nine. At latitudes above 30 deg, these higher-order modes are not visible.
Current usage metrics show cumulative count of Article Views (full-text article views including HTML views, PDF and ePub downloads, according to the available data) and Abstracts Views on Vision4Press platform.
Data correspond to usage on the plateform after 2015. The current usage metrics is available 48-96 hours after online publication and is updated daily on week days.
Initial download of the metrics may take a while.