Fig. 2.
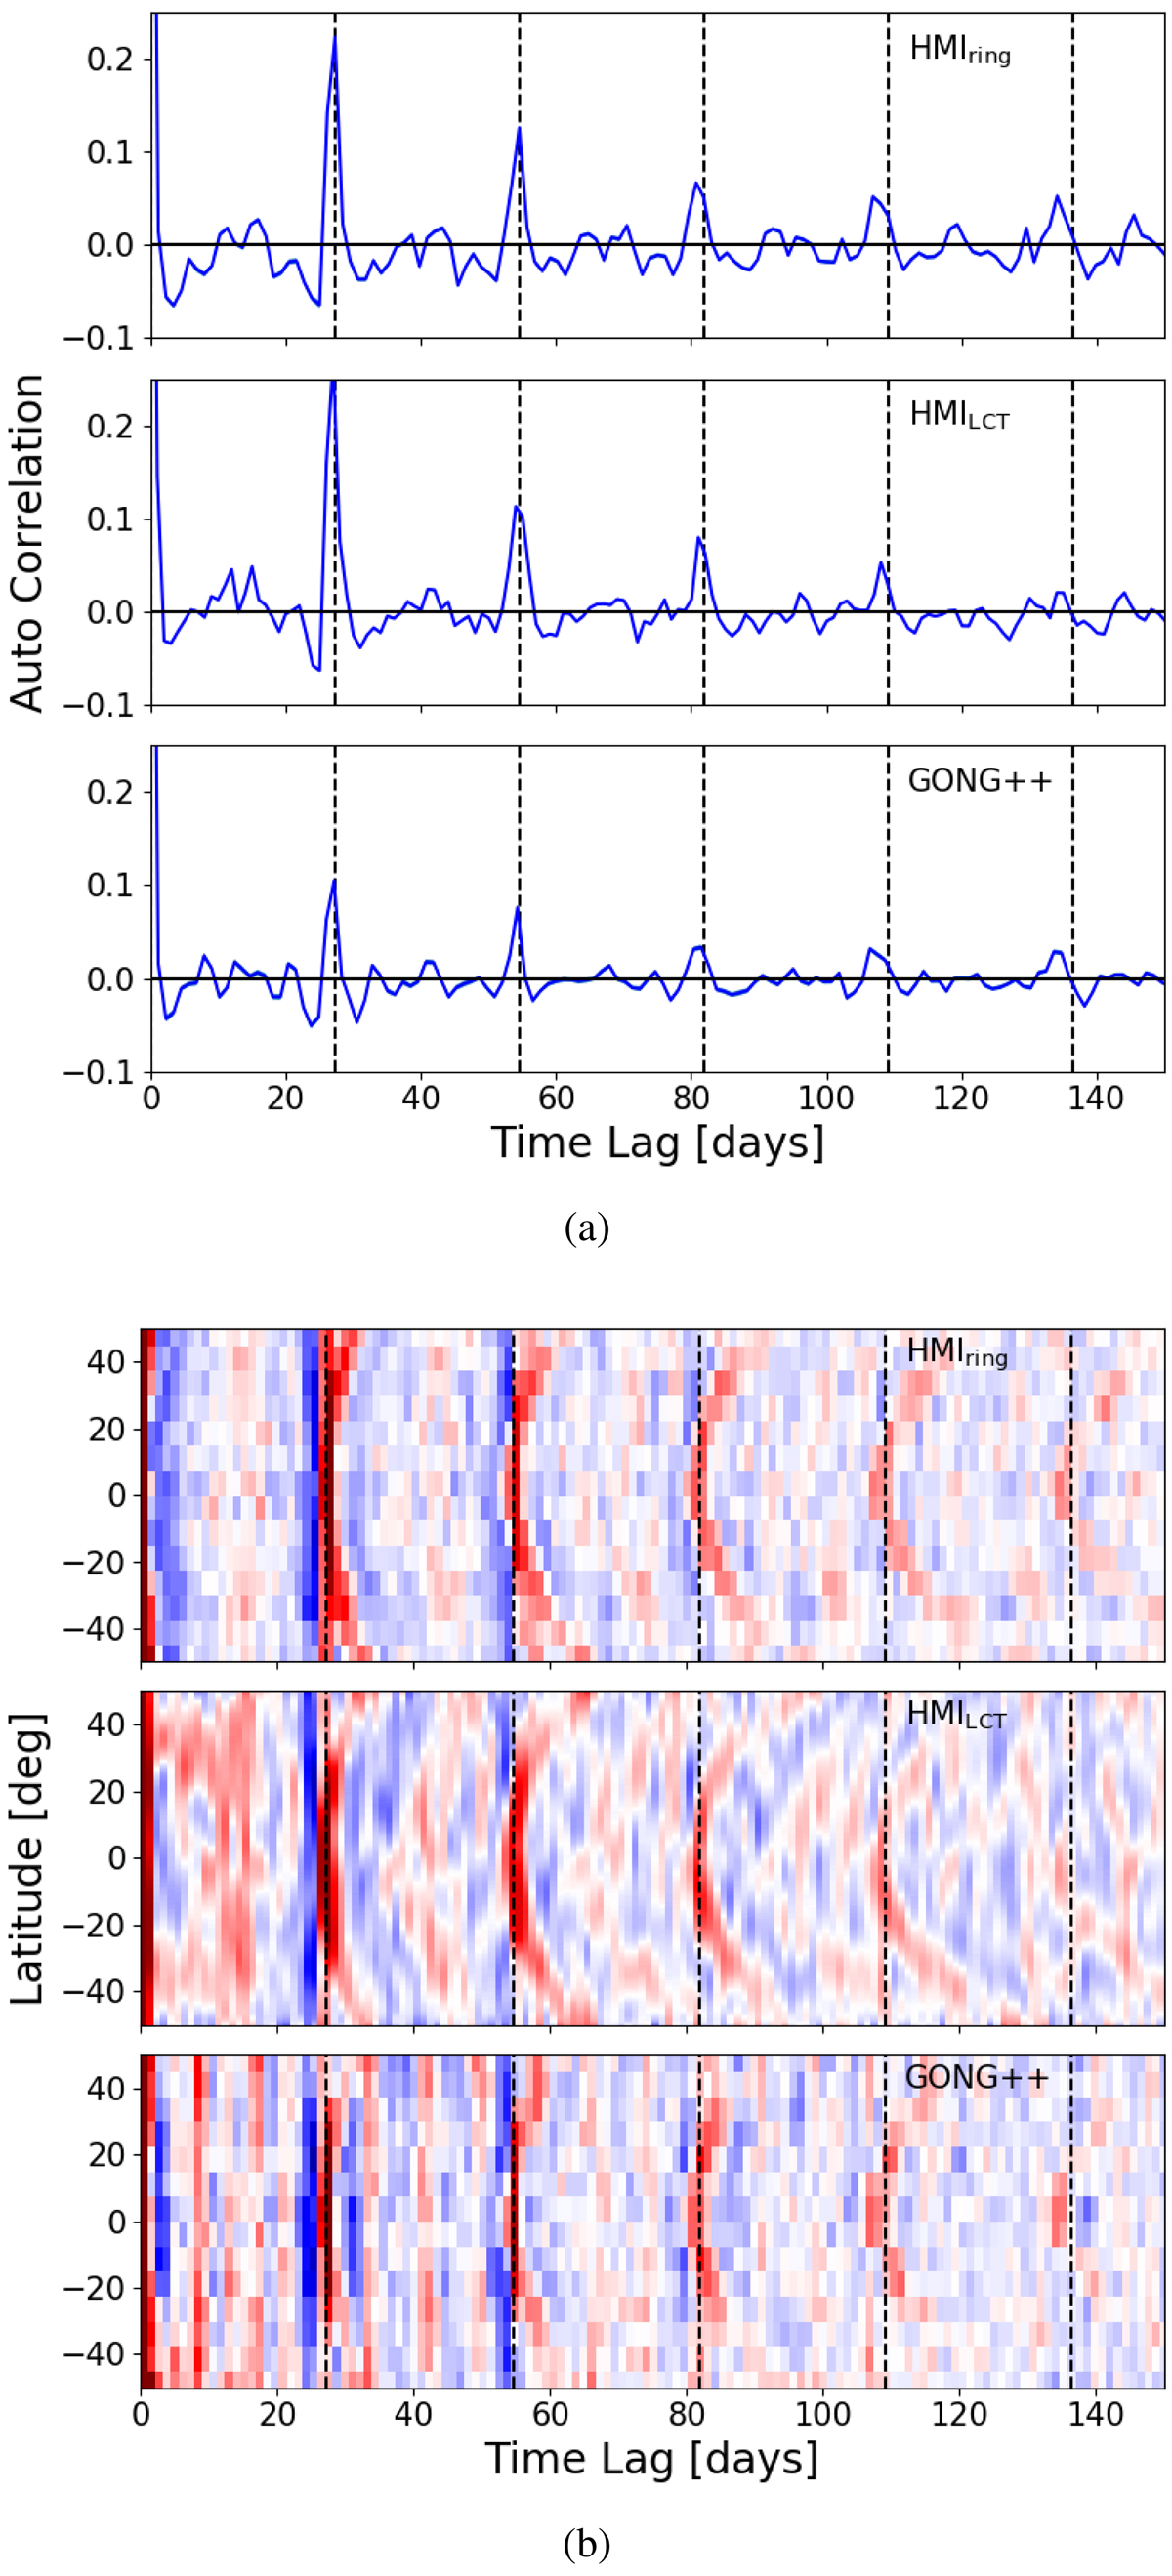
Top: temporal auto-correlation function of the EW flows at the equator for HMI RDA, LCT, and GONG++ RDA. A signal is seen to persist for at least five solar rotations. Statistical error bars are comparable to line thickness and hence are not shown. Bottom: 2D map of the EW auto-correlation maps as a function of latitude and time lag. The deflection with latitude is qualitatively consistent with differential rotation. The dashed vertical lines in each image indicate multiples of the equatorial rotation period.
Current usage metrics show cumulative count of Article Views (full-text article views including HTML views, PDF and ePub downloads, according to the available data) and Abstracts Views on Vision4Press platform.
Data correspond to usage on the plateform after 2015. The current usage metrics is available 48-96 hours after online publication and is updated daily on week days.
Initial download of the metrics may take a while.