Fig. 3.
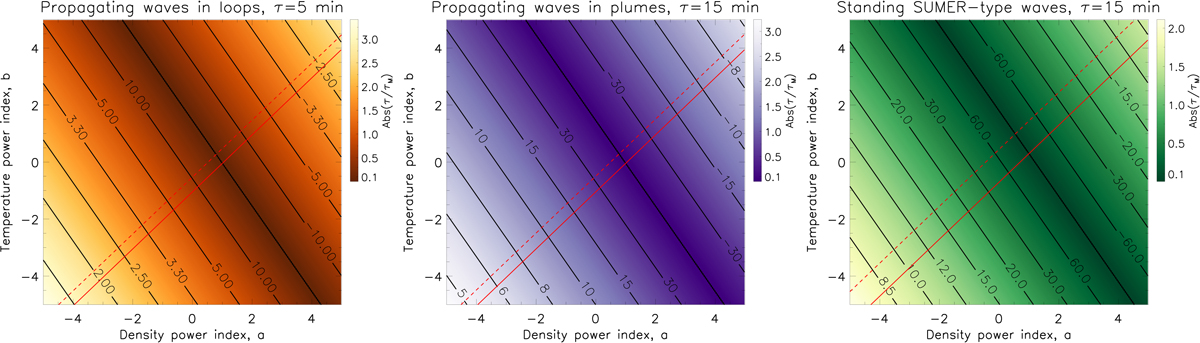
Estimations of τM (the black contours, in minutes) for varying heating models (power indices a and b) in warm and less dense quiescent loops (left), polar plumes (middle), and hot and dense loops (right). For specific combinations of the plasma density and temperature for these cases see Sect. 4. The colour schemes in all panels show the ratio of τM to typical periods τ of slow waves observed in those structures. The red solid lines show the values of a and b, above which the thermal mode becomes unstable. The red dashed lines indicate the intervals for which the thermal mode instability growth time is up to 5 times longer than the corresponding acoustic period τ.
Current usage metrics show cumulative count of Article Views (full-text article views including HTML views, PDF and ePub downloads, according to the available data) and Abstracts Views on Vision4Press platform.
Data correspond to usage on the plateform after 2015. The current usage metrics is available 48-96 hours after online publication and is updated daily on week days.
Initial download of the metrics may take a while.