Fig. 2.
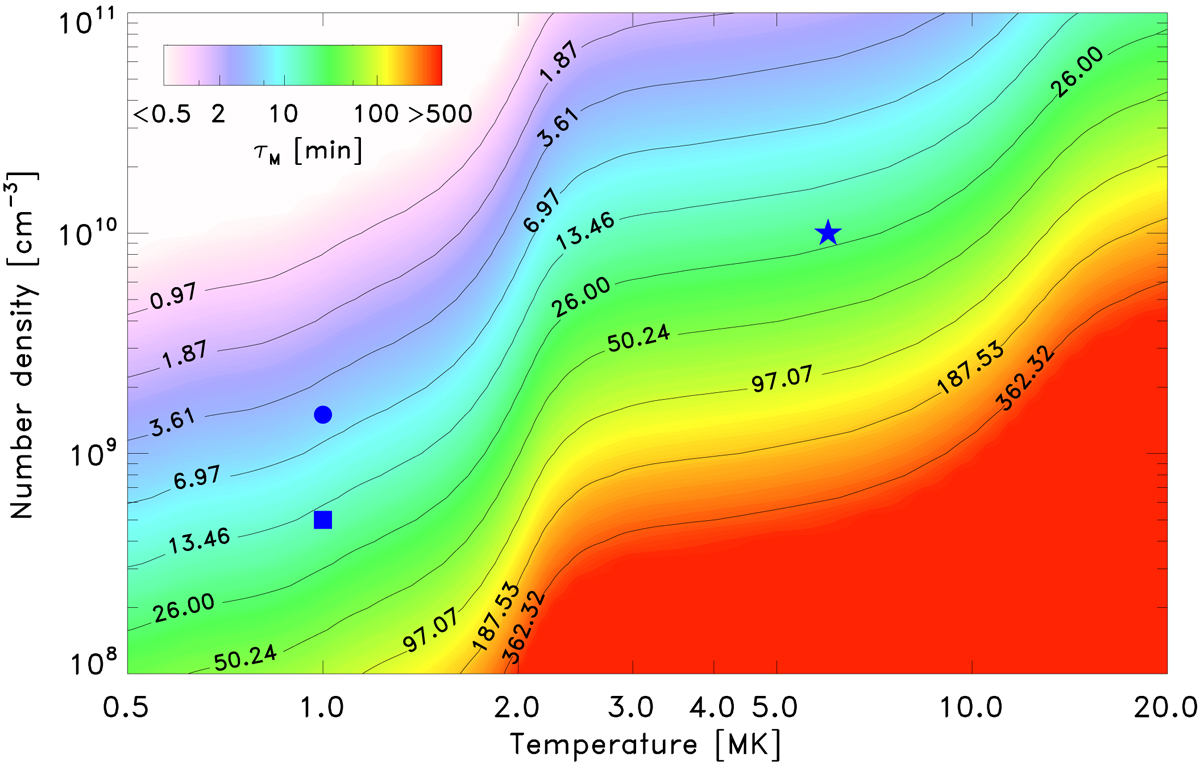
Characteristic thermal misbalance time τM (11) for typical coronal densities and temperatures and a fixed heating model a = 0.5 and b = −3.5, for which both acoustic and thermal modes are stable over the entire intervals of plasma densities and temperatures considered (see Fig. 1). The colour scheme is adjusted so that the values of τM from about 10 min to 100 min are shown in green. The blue symbols illustrate typical combinations of coronal plasma density and temperature in hot and dense loops in active regions (star), warm and less dense quiescent loops (circle), and polar plumes (box).
Current usage metrics show cumulative count of Article Views (full-text article views including HTML views, PDF and ePub downloads, according to the available data) and Abstracts Views on Vision4Press platform.
Data correspond to usage on the plateform after 2015. The current usage metrics is available 48-96 hours after online publication and is updated daily on week days.
Initial download of the metrics may take a while.