Fig. 6.
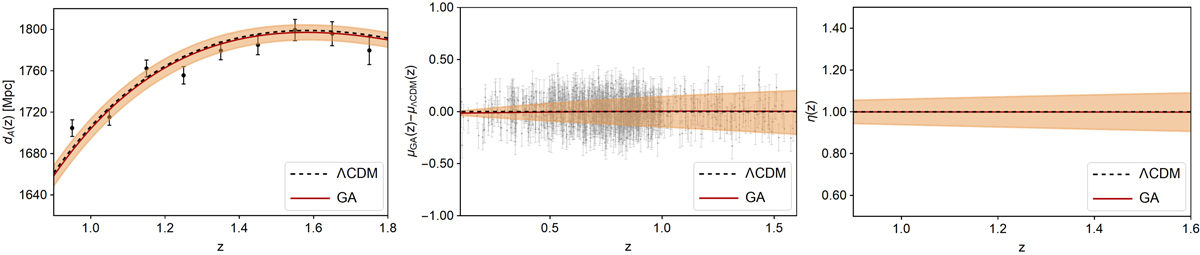
Left: reconstruction of the angular diameter distance dA(z) from the mock Euclid data with the GA approach. The dashed black line is ΛCDM, the solid red line is the GA fit and the shaded region corresponds to the 1σ GA errors. Centre: results on the distance modulus μ(z) from the mock Euclid+LSST+DESIRE data with the GA approach. The dashed line at zero is ΛCDM, the red line is the GA fit and the shaded region corresponds to the 1σ GA errors. For clarity, we only show one thousand of the total SnIa points. Right: reconstruction of the η(z) parameter in the range z ∈ [0.9, 1.6]. In all cases the error bars of the data points correspond to 1σ uncertainty.
Current usage metrics show cumulative count of Article Views (full-text article views including HTML views, PDF and ePub downloads, according to the available data) and Abstracts Views on Vision4Press platform.
Data correspond to usage on the plateform after 2015. The current usage metrics is available 48-96 hours after online publication and is updated daily on week days.
Initial download of the metrics may take a while.