Fig. 4.
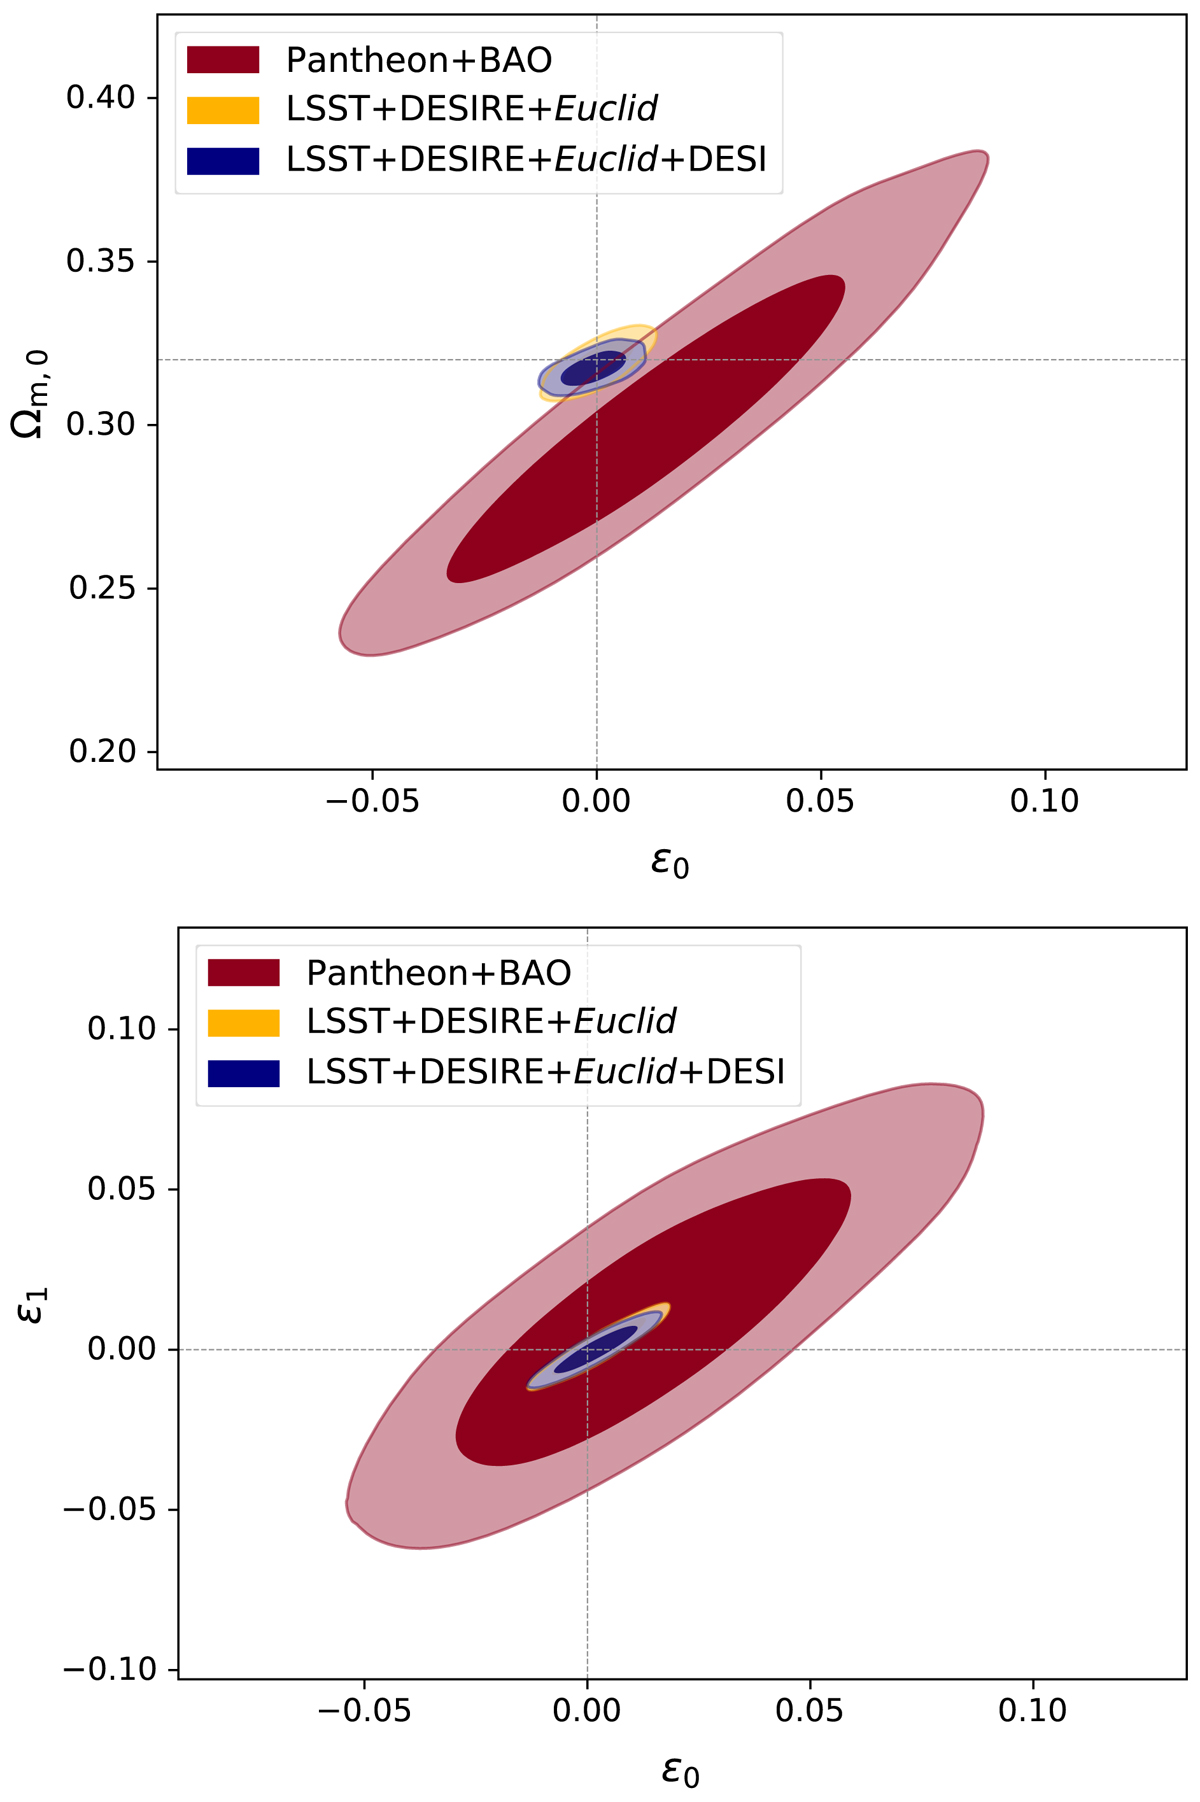
2D contours on Ωm, 0, ϵ0 and ϵ1, using the combination of BAO and SnIa dataset given by currently available data (red contours), LSST supernovae and Euclid BAO data (yellow contours), and the combination of LSST supernovae with BAO forecasts coming from the combination of Euclid and DESI (blue contours). These results refer to the constant (top panel) and binned (bottom panel) ϵ(z) cases. The dashed lines identify the limit ϵ(z) = 0.
Current usage metrics show cumulative count of Article Views (full-text article views including HTML views, PDF and ePub downloads, according to the available data) and Abstracts Views on Vision4Press platform.
Data correspond to usage on the plateform after 2015. The current usage metrics is available 48-96 hours after online publication and is updated daily on week days.
Initial download of the metrics may take a while.