Fig. 3.
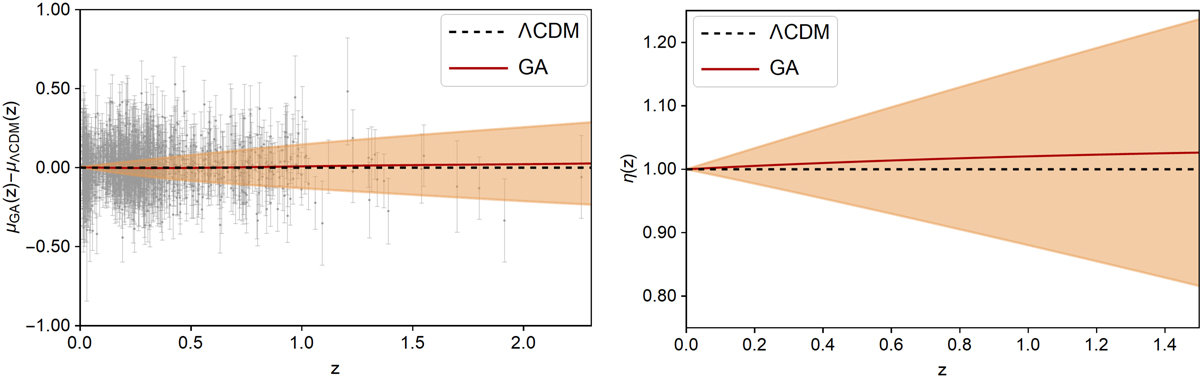
Left: distance modulus based on the Pantheon SnIa set, rescaled by the best-fit ΛCDM model (Ωm, 0 = 0.297 ± 0.018). The dashed line at zero corresponds to ΛCDM, the red line is the GA fit, and the shaded region corresponds to the 1σ GA errors. Right: duality relation η(z) for the GA reconstruction of dA(z) from the BAO data and the luminosity distance dL(z) based on the Pantheon SnIa set. The dashed line at unity is ΛCDM, the red line is the GA fit, and the shaded region is the 1σ GA errors.
Current usage metrics show cumulative count of Article Views (full-text article views including HTML views, PDF and ePub downloads, according to the available data) and Abstracts Views on Vision4Press platform.
Data correspond to usage on the plateform after 2015. The current usage metrics is available 48-96 hours after online publication and is updated daily on week days.
Initial download of the metrics may take a while.