Fig. B.1
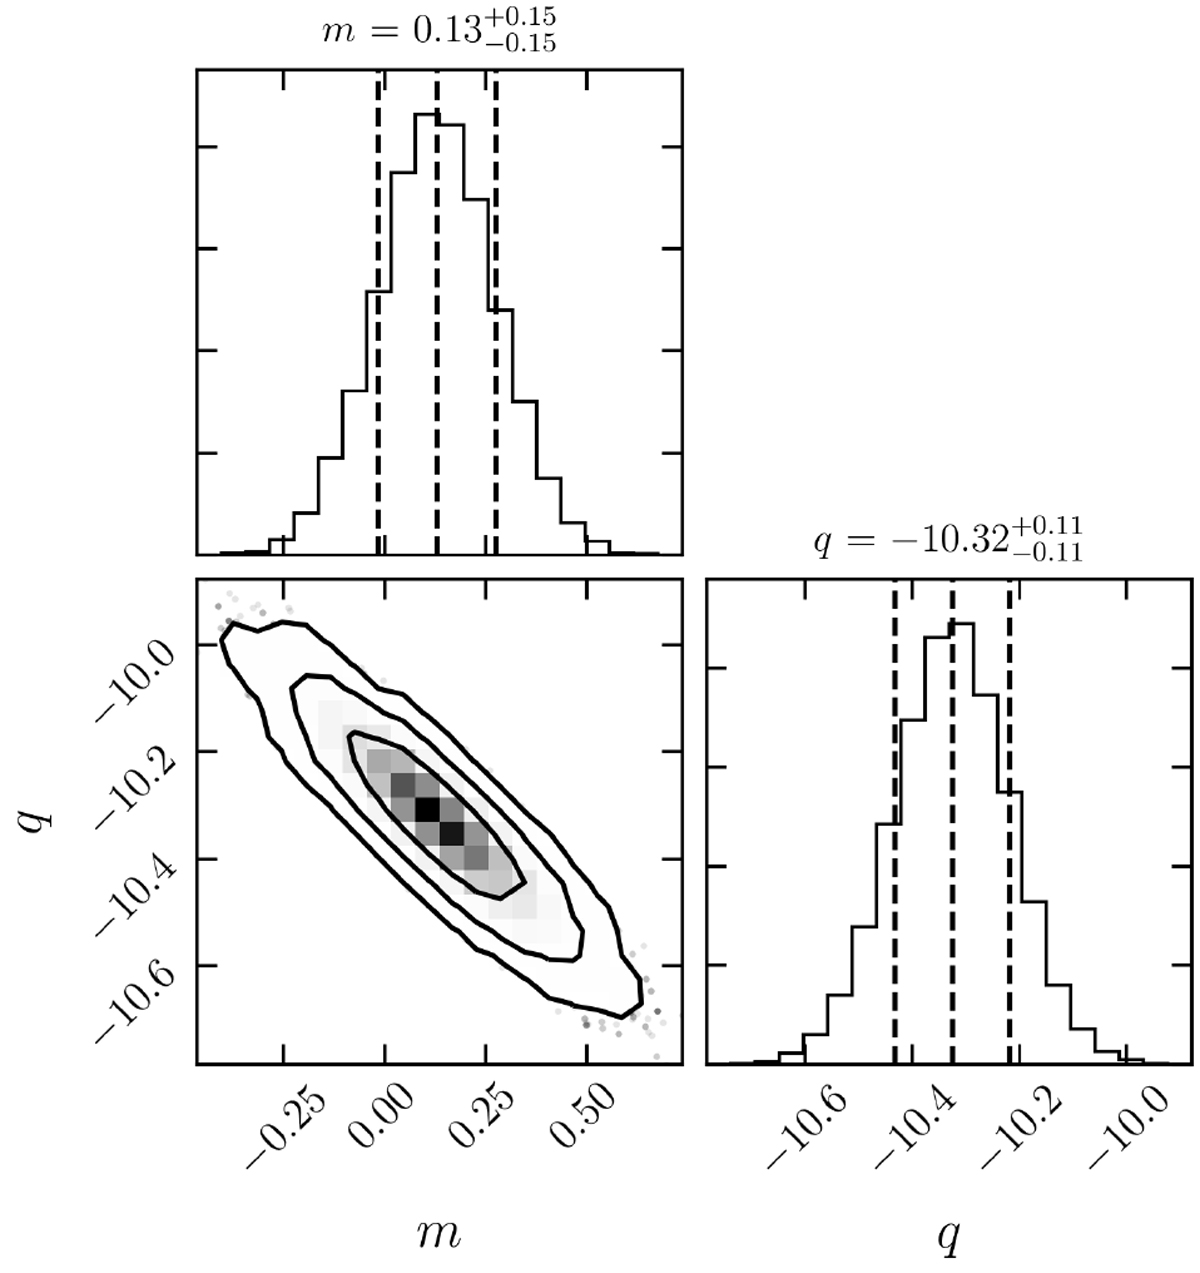
Example of one- and two-dimensional marginalized posterior distributions of the free parameters in our model. The black curves in the two-dimensional distribution correspond to regions enclosing 68%, 95%, and 99.7% of the total probability, while the black vertical lines in the one-dimensional marginalised distributions correspond to the 16th, 50th, and 84th percentiles, used to estimate the uncertainties on the models’ parameters.
Current usage metrics show cumulative count of Article Views (full-text article views including HTML views, PDF and ePub downloads, according to the available data) and Abstracts Views on Vision4Press platform.
Data correspond to usage on the plateform after 2015. The current usage metrics is available 48-96 hours after online publication and is updated daily on week days.
Initial download of the metrics may take a while.